OBVoscillatorTitle: OBV Oscillator
Author: OsborneCapital
The OBV (On Balance Volume) Oscillator developed by OsborneCapital is a distinctive variant from commonly published OBV indicators. This script capitalizes on the primary concept of the OBV, which is to cumulatively add or subtract the entire volume of each bar to a total, based on whether the closing price was higher or lower than the previous close. However, the OBV Oscillator by OsborneCapital improves upon this by introducing an additional layer of analysis.
Key Differences:
Oscillator Formulation:
The original OBV serves as a cumulative measure of buying and selling pressure. It does not naturally oscillate around a zero line. This script transforms OBV into an oscillator, offering a normalized view around a baseline (zero) for a more intuitive interpretation of buying and selling pressure.
Normalized Scaling:
The OBV Oscillator scales the OBV values down by a user-defined factor (default 1000), helping adapt the indicator to the magnitudes of the underlying market's volume profile.
Moving Average Comparison:
This script compares the scaled OBV with a Moving Average (MA) over a user-defined period, enhancing the visibility of divergences and convergences between volume trends and price action.
Usage:
The OBV Oscillator by OsborneCapital provides visual cues about the underlying buying or selling pressure, which is not directly visible from the price chart:
- Above zero line: Suggests the dominance of buying pressure, which may indicate an ongoing bullish sentiment.
- Below zero line: Indicates the dominance of selling pressure, hinting at bearish sentiment.
- Crossing the zero line: A change in the trend's direction, from bullish to bearish or vice versa.
Markets and Conditions:
The OBV Oscillator can be used across various markets, including but not limited to stocks, forex, cryptocurrencies, commodities, and futures. As this script fundamentally builds on volume analysis, it tends to be more effective in markets where volume information is reliable and significant.
It's always recommended to use this tool in conjunction with other indicators and analysis methods, as it mainly provides insights into volume trends and doesn't consider price levels or price-based trends. The indicator can be particularly effective in identifying potential breakouts when there's a divergence between the OBV Oscillator and the price trend.
Please remember, no indicator alone can guarantee success in trading, and a comprehensive approach, including risk management, should always be employed.
Buscar en scripts para "volume profile"

Vwap based Supply and Demand Heatmap_V1This is a Multi-time frame "Thermographic Vwap based heatmap" showing Highest volume Vwap supply and demand zones.
User has 3 inputs for time frames to choose from or layer. It comes preset with "Short" and "Mid" time frame enabled and user can choose to add an additional layer if they would like for longer time frame analysis. If ALL time frames are enabled, fewer levels will show overall due to the 500 map limit, But zones will become brighter, larger, and more "precise" as they overlap and seek out the highest volume concentration amongst all levels.
What is the map showing you?
The heat map goes through each user selected time frame and searches for the highest volume candle and plots a zone based of that candles Vwap and high. These zones act as dynamic support and resistance. Each zone will "Degrade" and disappear over time and show positive when price has broken, cleared and held above it. The shift in color however is not immediate in change, rather transitional, so as not to "Repaint" causing false sense of clearing a zone. All negative zones (Price below) are colored red. User can choose to change any of the maps color's if they would like.
Time frame MUST be larger than your current charts resolution.-
Example- If on a 3min chart, user would choose any time frame LARGER than 3 min to display a map from.
Time frames the zones work best on are 1,3,5,15 min, paired with maps such as "Daily, Weekly, 240min(4hr), 60min" etc for intraday scalping or trend style trading. If on a larger time frame, 60mi, 4hr, Daily, user would choose larger maps like Daily, Weekly, monthly only. User can choose to display all, or just one time frame's zone at a time if they would like. If on a smaller intraday chart, You can start with "Daily" map first, increase opacity if the map is to dark. Then add additional time frames up or down in time if you'd like so long as maps time frame is larger than the charts.
If on a 1, 3, or 5min chart, you can also try the 30,60, or 240min maps for finer granularity and "Scalping" support and resistance.
If you choose a set of time frames, and do not see maps interacting with current price, then cycle out to a higher chart time frame and maps that are one or two time frames higher than current chart resolution.
These maps are showing you where supply and demand are situated since they are looking for the "Highest Volume" candles in each time frame you choose-
The range cast from the highest volume launch candle have proven to be strong support or resistance. Think of "Trapped trader's" if viewing over head supply level's, these traders will sell into a push higher until cleared. Vice versa, if viewing a demand level below, think of a "Base", especially on higher time frames. An area of high volume participation, where buyer's have shown support, and launched a run from. When price cycles back to these zone's, one would expect support from them.
Each zone has a high or low, you will often see price discovery "Test" the high and low of each zone. Probing as they say in Auction market theory to see if there are still buyers, or seller's present. I will often wait for the probe of the high or low of a zone, then look to participate once they have wicked the area and cleared the inventory there and start to move to the opposing side of the zone I am looking to participate in. Think of "Value low, and Value high" in market or volume profile. Market maker's aim to test the participants "Max pain", and absorb stops in each direction. With that said the maps are not meant to be "Lines in the sand" or concrete level's, they are simply hot or cold zones where you could expect participation to happen, the "Hotter" or "Brighter" a zone is the higher the volume concentration is there at that price area. So act accordingly and use this as an addition to your analysis, not the ONLY thing you take into consideration.
With that said, Trading is RISKY, The creator of this code is NOT a licensed professional, and this tool, nor description is meant to be trading or financial advice! The user whom downloads this tool assumes ALL responsibility and liability associated with the financial risk that comes with the use of this analysis tool and trading in general. The creator of the code advises all users to do their due diligence and contact a licensed broker dealer before making ANY financial decision's based off of analysis done with this tool.
Any question's, Comments or concerns feel free to message via Tradingview platform.
Enjoy-
JMF

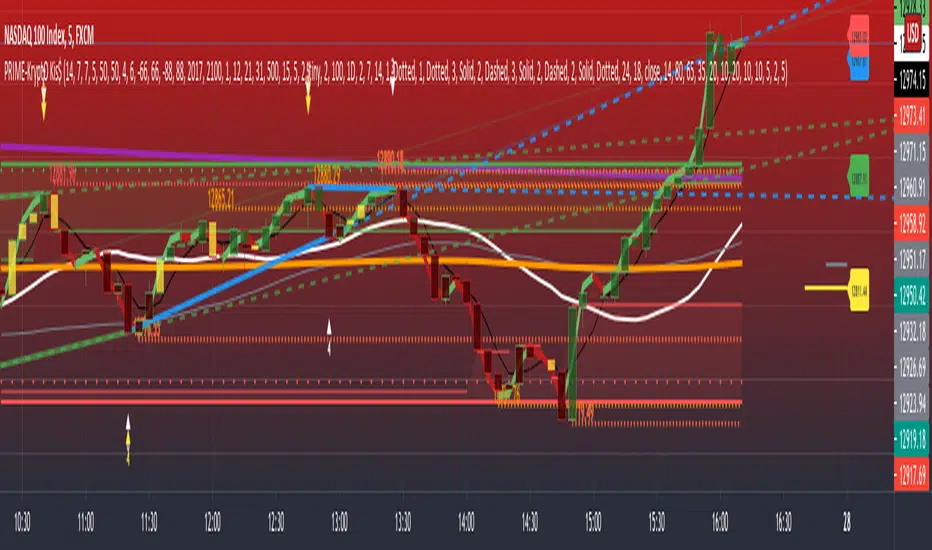
PRIME - Krypto Kiss+CCI+VPIntroducing from Prime Academy, the experimental "KryptO Kis$" algorithm, which combines our most powerful scripts all in one indicator. Available to the user are a full options platform to adjust parameters as well as individually blind indications for precise chart analysis. The following algorithms have been utilized:
* Prime Pulse (3 Candle System) - The original impulse and momentum indication system, it take rsi and tsi data to provide users with the indication of initial impulses, as well as a yellow candle to ascertain when there is a possible change of momentum in the current impulse.
* 5 SMA - The original Sniper Cross system seen from previous strategies, using the 4, 21, 50, 185, and 800 SMA's to determine changes of trend, continuation and support levels.
*CCI Indication on Chart - The system provides realtime CCI data in correlation to price positions within the general chart matrix, receiving system variables from various crosses on the 100 to -100 scale for CCI. Bullish and Bearish indications are clearly defined by separate colors.
* Volume Profile with tags - This system provides current volume data for the current time frame and sequence, also giving available tags at prices holding high volume orders, historically and present as indicated by the difference in length of indications. color saturations indicate the intensity of volume at the price in question .
* Shadow ZoneZ - Provides Support and resistance levels using rsi overbought and over sold data, sourced on the close of previous prices. Also embedded in the code is an additional volume confluence via indications of dotted lines with prices available, giving sequence positions of "Whales" and their support and resistance levels by order volume at price.
* An added bonus of the Shadow ZoneZ is the auto trend line and trend channel function , as well as the highlighted zones of liquidity waiting to be filled from previous impulses and lack of present retracements.
Any questions can be directed here on site via Direct Message. Any feedback is welcomed, and thank you in advance. Trade Well, Family!
- Dee Prime
//Disclaimer:
//Trading success is all about following your trading strategy and the indicators should fit within your trading strategy, and not to be traded upon solely
//The script is for informational and educational purposes only. Use of the script does not constitute professional and/or financial advice.
//You alone have the sole responsibility of evaluating the script output and risks associated with the use of the script.
//In exchange for using the script, you agree not to hold the publishing TradingView user liable for any possible claim for damages arising from any decision you make based on use of the script.
Wyckoff Method - Comprehensive Analysis# WYCKOFF METHOD - QUICK REFERENCE CHEAT SHEET
## 🟢 STRONGEST BUY SIGNALS
### 1. SPRING ⭐⭐⭐⭐⭐
- **What:** False breakdown below support on LOW volume
- **Look for:** Quick reversal, close above support
- **Entry:** When price closes back in range
- **Stop:** Below spring low
- **Target:** Top of range minimum
### 2. SOS (Sign of Strength) ⭐⭐⭐⭐
- **What:** Breakout above resistance on HIGH volume
- **Look for:** Wide spread up bar, strong close
- **Entry:** On breakout or wait for LPS pullback
- **Stop:** Below range top
- **Target:** Height of range projected up
### 3. SHAKEOUT ⭐⭐⭐⭐
- **What:** Sharp move below support with HIGH volume, immediate reversal
- **Look for:** Long lower wick, closes strong
- **Entry:** When price reclaims support
- **Stop:** Below shakeout low
- **Target:** Previous resistance
---
## 🔴 STRONGEST SELL SIGNALS
### 1. UTAD (Upthrust After Distribution) ⭐⭐⭐⭐⭐
- **What:** False breakout above resistance, quick rejection
- **Look for:** Spike high, weak close, often high volume
- **Entry:** When price closes back in range
- **Stop:** Above UTAD high
- **Target:** Bottom of range minimum
### 2. SOW (Sign of Weakness) ⭐⭐⭐⭐
- **What:** Breakdown below support on HIGH volume
- **Look for:** Wide spread down bar, weak close
- **Entry:** On breakdown or wait for LPSY rally
- **Stop:** Above range bottom
- **Target:** Height of range projected down
### 3. UPTHRUST ⭐⭐⭐⭐
- **What:** Move above resistance on LOW volume, weak close
- **Look for:** Long upper wick, closes in lower half
- **Entry:** When resistance holds
- **Stop:** Above upthrust high
- **Target:** Support level
---
## 📊 ACCUMULATION PHASES (Bottom Formation)
```
PHASE A: Stopping the Downtrend
├─ PS (Preliminary Support) - First buying
├─ SC (Selling Climax) - Panic bottom ⚠️ KEY EVENT
├─ AR (Automatic Rally) - Relief bounce
└─ ST (Secondary Test) - Retest SC low
PHASE B: Building the Cause
├─ Trading range forms
├─ Multiple tests of support
├─ Volume decreasing
└─ Absorption occurring
PHASE C: The Test
├─ SPRING - False breakdown ⚠️ KEY EVENT
└─ TEST - Support holds on low volume
PHASE D: Dominance Emerges
├─ SOS - Breakout ⚠️ KEY EVENT
├─ LPS - Last Point of Support (pullback)
└─ BU - Backup
PHASE E: Markup
└─ New uptrend, strong momentum
```
**Background Color:** Blue → Green (getting brighter)
**Action:** Buy in Phase C/D, Hold through Phase E
---
## 📊 DISTRIBUTION PHASES (Top Formation)
```
PHASE A: Stopping the Uptrend
├─ PSY (Preliminary Supply) - First selling
├─ BC (Buying Climax) - Euphoric top ⚠️ KEY EVENT
├─ AR (Automatic Reaction) - Sharp drop
└─ ST (Secondary Test) - Retest BC high
PHASE B: Building the Cause
├─ Trading range forms
├─ Multiple tests of resistance
├─ Demand being absorbed
└─ Volume patterns change
PHASE C: The Test
└─ UTAD - False breakout ⚠️ KEY EVENT
PHASE D: Dominance Emerges
├─ SOW - Breakdown ⚠️ KEY EVENT
└─ LPSY - Last Point of Supply (rally to exit)
PHASE E: Markdown
└─ New downtrend, strong selling
```
**Background Color:** Orange → Red (getting darker)
**Action:** Sell in Phase C/D, Stay out during Phase E
---
## 💰 VOLUME SPREAD ANALYSIS (VSA)
| Signal | Meaning | Color | Implication |
|--------|---------|-------|-------------|
| **ND** (No Demand) | Up bar, LOW volume | 🟠 Orange | Weakness - uptrend ending |
| **NS** (No Supply) | Down bar, LOW volume | 🔵 Blue | Strength - downtrend ending |
| **SV** (Stopping Volume) | VERY HIGH volume, narrow spread | 🟣 Purple | Potential reversal |
| **UT** (Upthrust) | Above resistance, LOW vol, weak close | 🔴 Red | Sell signal |
| **SO** (Shakeout) | Below support, HIGH vol, strong close | 🟢 Green | Buy signal |
---
## 🎯 VOLUME INTERPRETATION
| Volume Level | Bar Color | Meaning |
|--------------|-----------|---------|
| **VERY HIGH** (>2x average) | Dark Green/Red | Climax, potential reversal |
| **HIGH** (>1.5x average) | Light Green/Red | Strong interest |
| **NORMAL** | Gray | Average trading |
| **LOW** (<0.7x average) | Faint Gray | Testing, no interest |
---
## ⚖️ EFFORT vs RESULT
| Scenario | Volume | Spread | Meaning |
|----------|--------|--------|---------|
| **High Effort, Low Result** | HIGH | Narrow | ⚠️ Potential reversal |
| **Low Effort, High Result** | LOW | Wide | ⚠️ Trend weakening |
| **High Effort, High Result** | HIGH | Wide | ✅ Strong trend |
| **Low Effort, Low Result** | LOW | Narrow | 😴 No interest |
---
## 📏 TRADING RULES
### ✅ DO:
- ✅ Wait for confirmation before entering
- ✅ Trade in direction of higher timeframe
- ✅ Use springs and UTAD as primary signals
- ✅ Measure trading range for targets
- ✅ Place stops outside the range
- ✅ Look for volume confirmation
- ✅ Check multiple timeframes
- ✅ Focus on Phase C and D events
### ❌ DON'T:
- ❌ Buy during Phase E Markdown
- ❌ Sell during Phase E Markup
- ❌ Trade against major trend
- ❌ Ignore volume signals
- ❌ Enter without clear stop loss
- ❌ Trade every signal
- ❌ Use on very low timeframes without practice
- ❌ Ignore the context
---
## 🎪 COMPOSITE OPERATOR (Smart Money)
### 💰 Green Money Symbol (Bottom)
- **Meaning:** Institutions accumulating
- **Location:** Demand zones, springs, tests
- **Action:** Follow the smart money - buy
### 💰 Red Money Symbol (Top)
- **Meaning:** Institutions distributing
- **Location:** Supply zones, UTAD, weak rallies
- **Action:** Follow the smart money - sell
---
## 📍 SUPPLY & DEMAND ZONES
### 🟢 Demand Zones (Green Boxes)
- **Created at:** SC, Spring, Shakeout
- **Represents:** Where smart money bought
- **Action:** Look for bounces
### 🔴 Supply Zones (Red Boxes)
- **Created at:** BC, UTAD, Upthrust
- **Represents:** Where smart money sold
- **Action:** Look for rejections
---
## 🎯 TARGET CALCULATION
### Measured Move Method
```
1. Measure trading range height
Example: Top at 120, Bottom at 100 = 20 points
2. Add to breakout point (accumulation)
Breakout at 120 + 20 = Target: 140
3. Or subtract from breakdown (distribution)
Breakdown at 100 - 20 = Target: 80
```
### Multiple Targets
- **Conservative:** 1x range height (100% probability reached)
- **Moderate:** 1.5x range height (70% probability)
- **Aggressive:** 2x range height (40% probability)
---
## ⏰ TIMEFRAME GUIDE
| Timeframe | Use For | Reliability | Recommended For |
|-----------|---------|-------------|-----------------|
| **Weekly** | Major trends | ⭐⭐⭐⭐⭐ | Position traders |
| **Daily** | Swing trades | ⭐⭐⭐⭐⭐ | Most traders |
| **4-Hour** | Active swing | ⭐⭐⭐⭐ | Active traders |
| **1-Hour** | Day trading | ⭐⭐⭐ | Experienced only |
| **15-Min** | Scalping | ⭐⭐ | Experts only |
**Golden Rule:** Always check one timeframe higher for context!
---
## 🚨 ALERT PRIORITY
### 🔔 MUST-HAVE ALERTS
1. Spring
2. UTAD
3. SOS
4. SOW
### 🔔 NICE-TO-HAVE ALERTS
5. Selling Climax (SC)
6. Buying Climax (BC)
7. Smart Money Accumulation
8. Smart Money Distribution
### 🔔 CONFIRMATION ALERTS
9. Phase E Markup
10. Phase E Markdown
---
## 💡 QUICK DECISION TREE
```
Is there a clear trading range?
├─ YES
│ ├─ Did price break BELOW support?
│ │ ├─ Volume LOW + Quick reversal = SPRING → BUY ✅
│ │ └─ Volume HIGH + Stays down = Breakdown → SELL ⚠️
│ │
│ └─ Did price break ABOVE resistance?
│ ├─ Volume LOW + Quick reversal = UTAD → SELL ✅
│ └─ Volume HIGH + Stays up = Breakout → BUY ⚠️
│
└─ NO
├─ Strong uptrend = Wait for re-accumulation
└─ Strong downtrend = Wait for re-distribution
```
---
## 📝 PRE-TRADE CHECKLIST
Before entering any trade:
- Identified the current Wyckoff phase
- Confirmed with volume analysis
- Checked higher timeframe trend
- Located supply/demand zones
- Identified clear entry point
- Set stop loss level
- Calculated target (risk:reward >1:2)
- Verified position size (risk 1-2%)
- Have at least 2 confirming signals
- Not trading against major trend
---
## 🧠 REMEMBER
**The Three Laws:**
1. **Supply & Demand** - Price is determined by imbalance
2. **Cause & Effect** - Range size predicts move size
3. **Effort & Result** - Volume should confirm price movement
**The Key Principle:**
> "Trade with the Composite Operator (smart money), not against them"
**Best Setups:**
1. Spring in accumulation (Phase C)
2. UTAD in distribution (Phase C)
3. SOS breakout (Phase D)
4. SOW breakdown (Phase D)
**When in Doubt:**
- ❓ Stay out
- 📈 Use higher timeframe
- 📚 Review the documentation
- 🎯 Wait for clearer signal
---
## 📱 INDICATOR SETTINGS QUICK SETUP
**For Stocks/Crypto (Good Volume Data):**
- Volume MA Length: 20
- High Volume Multiplier: 1.5
- Climax Volume: 2.0
- Swing Length: 5
**For Forex (Limited Volume Data):**
- Volume MA Length: 20
- High Volume Multiplier: 1.3
- Climax Volume: 1.8
- Swing Length: 7
- Turn OFF "Volume Confirmation"
**For Day Trading:**
- Swing Length: 3
- All other settings: Default
**For Position Trading:**
- Swing Length: 7-10
- Volume MA Length: 30
- Use Daily/Weekly charts
---
## 🎓 SKILL PROGRESSION
### Beginner (Month 1-2)
- Focus on: SC, Spring, SOS
- Timeframe: Daily only
- Goal: Identify phases correctly
### Intermediate (Month 3-6)
- Add: All accumulation events
- Timeframe: Daily + 4H
- Goal: Trade springs profitably
### Advanced (Month 6-12)
- Add: Distribution events, VSA
- Timeframe: Multiple timeframes
- Goal: Trade complete cycles
### Expert (Year 2+)
- Master: All events, all timeframes
- Combine: With other methodologies
- Goal: Consistent profitability
---
**Print this sheet and keep it next to your trading desk!**
*Remember: Quality over quantity. Wait for the best setups.*
# Wyckoff Method - Comprehensive Analysis Indicator
## Complete Implementation Guide for TradingView Pine Script
---
## TABLE OF CONTENTS
1. (#overview)
2. (#installation)
3. (#theory)
4. (#components)
5. (#signals)
6. (#strategies)
7. (#settings)
8. (#alerts)
9. (#patterns)
10. (#troubleshooting)
---
## OVERVIEW
This indicator implements Richard Wyckoff's complete trading methodology, including:
- **All 5 Phases** of Accumulation and Distribution
- **18+ Wyckoff Events** (PS, SC, AR, ST, Spring, SOS, LPS, BC, UTAD, SOW, etc.)
- **Volume Spread Analysis (VSA)** principles
- **Supply & Demand Zone** detection
- **Composite Operator** logic (Smart Money tracking)
- **Effort vs Result** analysis
- **Three Wyckoff Laws**: Supply/Demand, Cause/Effect, Effort/Result
---
## INSTALLATION
### Step 1: Copy the Code
1. Open the `wyckoff_comprehensive.pine` file
2. Select all code (Ctrl+A / Cmd+A)
3. Copy to clipboard (Ctrl+C / Cmd+C)
### Step 2: Add to TradingView
1. Go to TradingView.com
2. Open any chart
3. Click "Pine Editor" at the bottom of the screen
4. Click "New" or "Open"
5. Paste the entire code
6. Click "Save" and give it a name
7. Click "Add to Chart"
### Step 3: Verify Installation
You should see:
- Labels on the chart (PS, SC, Spring, SOS, etc.)
- Background colors indicating phases
- Volume analysis in the lower pane
- A table in the top-right corner showing current phase
---
## WYCKOFF METHOD THEORY
### The Three Fundamental Laws
#### 1. **Law of Supply and Demand**
- Price rises when demand exceeds supply
- Price falls when supply exceeds demand
- The indicator tracks volume vs price movement to identify imbalances
#### 2. **Law of Cause and Effect**
- A period of accumulation (cause) leads to markup (effect)
- A period of distribution (cause) leads to markdown (effect)
- Trading ranges build "cause" for future price movement
#### 3. **Law of Effort vs Result**
- **Effort** = Volume (energy put into the market)
- **Result** = Price movement (spread of the bar)
- High effort with low result = potential reversal
- Low effort with high result = trend weakness
### The Five Phases
#### **ACCUMULATION CYCLE**
**Phase A: Stopping the Downtrend**
- Preliminary Support (PS): First sign of buying
- Selling Climax (SC): Panic selling exhaustion
- Automatic Rally (AR): Bounce from SC
- Secondary Test (ST): Test of SC low on lower volume
**Phase B: Building the Cause**
- Trading range develops
- Supply being absorbed by composite operator
- Multiple tests of support and resistance
- Volume generally decreases
**Phase C: The Test (Spring)**
- False breakdown below support
- Traps late sellers
- Quick reversal on low volume
- Last chance to accumulate before markup
**Phase D: Dominance Emerges**
- Sign of Strength (SOS): Break above resistance
- Last Point of Support (LPS): Pullback opportunity
- Backup (BU): Final consolidation
- Demand clearly exceeds supply
**Phase E: Markup**
- New uptrend established
- Price moves rapidly higher
- Phase E can last months/years
- Original trading range becomes support
#### **DISTRIBUTION CYCLE**
**Phase A: Stopping the Uptrend**
- Preliminary Supply (PSY): First sign of selling
- Buying Climax (BC): Euphoric buying exhaustion
- Automatic Reaction (AR): Sharp selloff from BC
- Secondary Test (ST): Test of BC high on lower volume
**Phase B: Building the Cause**
- Trading range at top
- Demand being absorbed by composite operator
- Multiple tests of support and resistance
**Phase C: The Test (UTAD)**
- Upthrust After Distribution
- False breakout above resistance
- Traps late buyers
- Quick reversal
**Phase D: Dominance Emerges**
- Sign of Weakness (SOW): Break below support
- Last Point of Supply (LPSY): Rally opportunity to exit
- Supply clearly exceeds demand
**Phase E: Markdown**
- New downtrend established
- Price moves rapidly lower
- Original trading range becomes resistance
---
## INDICATOR COMPONENTS
### 1. EVENT LABELS
#### Accumulation Events (Green labels)
- **PS** = Preliminary Support
- **SC** = Selling Climax (largest label, most important)
- **AR** = Automatic Rally
- **ST** = Secondary Test
- **SPRING** = Spring (critical buy signal)
- **TEST** = Test of support
- **SOS** = Sign of Strength (breakout)
- **LPS** = Last Point of Support
- **BU** = Backup
#### Distribution Events (Red labels)
- **PSY** = Preliminary Supply
- **BC** = Buying Climax (largest label, most important)
- **AR** = Automatic Reaction
- **ST** = Secondary Test
- **UTAD** = Upthrust After Distribution (critical sell signal)
- **SOW** = Sign of Weakness
- **LPSY** = Last Point of Supply
#### VSA Events (Small colored labels)
- **ND** (Orange) = No Demand - weakness
- **NS** (Blue) = No Supply - strength
- **SV** (Purple) = Stopping Volume
- **UT** (Red) = Upthrust - weakness
- **SO** (Green) = Shakeout - strength
#### Composite Operator (💰 symbols)
- Green 💰 at bottom = Smart Money Accumulation
- Red 💰 at top = Smart Money Distribution
### 2. BACKGROUND COLORS
- **Light Blue** = Phase A (Accumulation)
- **Light Orange** = Phase A (Distribution)
- **Very Light Green** = Phase C (Accumulation Testing)
- **Very Light Red** = Phase C (Distribution Testing)
- **Light Green** = Phase D (Accumulation Strength)
- **Light Red** = Phase D (Distribution Weakness)
- **Green** = Phase E (Markup - Bull trend)
- **Red** = Phase E (Markdown - Bear trend)
### 3. SUPPLY & DEMAND ZONES
- **Green boxes** = Demand zones (where smart money accumulated)
- **Red boxes** = Supply zones (where smart money distributed)
- Zones extend 20 bars into the future
- Price reactions at these zones are significant
### 4. VOLUME PANEL
- **Dark Green/Red bars** = Very High Volume (climax)
- **Light Green/Red bars** = High Volume
- **Gray bars** = Normal Volume
- **Faint Gray bars** = Low Volume
- **Blue line** = Volume Moving Average
### 5. INFORMATION TABLE (Top Right)
Displays real-time analysis:
- **Current Phase** (A, B, C, D, or E)
- **Status** (description of what's happening)
- **Volume** (Very High, High, Normal, Low)
- **Spread** (Wide, Normal, Narrow)
- **Effort/Result** (Poor, Normal, Good)
- **Range** (YES if in trading range)
- **Bias** (BULLISH, BEARISH, or NEUTRAL)
---
## HOW TO READ THE SIGNALS
### STRONG BUY SIGNALS (in order of strength)
1. **SPRING** (strongest)
- False breakdown below support
- Look for: Low volume, quick reversal, close above support
- Entry: When price closes back above support level
- Stop: Below the spring low
2. **SOS (Sign of Strength)**
- Break above trading range resistance
- Look for: High volume, wide spread up bar
- Entry: On breakout or pullback to LPS
- Stop: Below trading range
3. **Shakeout (SO)**
- Similar to spring but more violent
- Look for: High volume, penetration of support, strong close
- Entry: When price reclaims support
- Stop: Below shakeout low
4. **LPS (Last Point of Support)**
- Pullback after SOS
- Look for: Low volume, shallow pullback
- Entry: When support holds
- Stop: Below LPS
5. **No Supply (NS)**
- Down bar on very low volume
- Indicates lack of selling pressure
- Confirms accumulation phase
### STRONG SELL SIGNALS (in order of strength)
1. **UTAD (Upthrust After Distribution)** (strongest)
- False breakout above resistance
- Look for: High volume spike, rejection, close below resistance
- Entry: When price closes back below resistance
- Stop: Above UTAD high
2. **SOW (Sign of Weakness)**
- Break below trading range support
- Look for: High volume, wide spread down bar
- Entry: On breakdown or rally to LPSY
- Stop: Above trading range
3. **Upthrust (UT)**
- Move above resistance on low volume, weak close
- Look for: Low volume, close in lower half of bar
- Entry: When resistance becomes resistance again
- Stop: Above upthrust high
4. **LPSY (Last Point of Supply)**
- Rally after SOW
- Look for: Low volume, weak rally
- Entry: When rally fails
- Stop: Above LPSY
5. **No Demand (ND)**
- Up bar on very low volume
- Indicates lack of buying pressure
- Confirms distribution phase
### NEUTRAL/WARNING SIGNALS
- **High Effort, Low Result** = Potential reversal coming
- **Stopping Volume** = Trend may be ending
- **Absorption** = Large volume with small movement (accumulation/distribution)
---
## TRADING STRATEGY EXAMPLES
### Strategy 1: Accumulation Range Breakout
**Setup:**
1. Identify trading range (blue background in Phase B)
2. Wait for Spring or Test (Phase C)
3. Wait for SOS breakout (Phase D)
**Entry:**
- Option A: Buy on SOS breakout
- Option B: Wait for LPS pullback (better risk/reward)
**Stop Loss:**
- Below the spring low or trading range bottom
**Target:**
- Measure height of trading range (cause)
- Project upward from breakout point (effect)
- Minimum target = range height
**Example:**
```
Trading Range: 100 to 120 (20 point range)
SOS Breakout at: 120
Target: 120 + 20 = 140 minimum
```
### Strategy 2: Distribution Range Breakdown
**Setup:**
1. Identify trading range after uptrend
2. Wait for UTAD (Phase C)
3. Wait for SOW breakdown (Phase D)
**Entry:**
- Option A: Sell on SOW breakdown
- Option B: Wait for LPSY rally (better risk/reward)
**Stop Loss:**
- Above the UTAD high or trading range top
**Target:**
- Measure height of trading range
- Project downward from breakdown point
- Minimum target = range height
### Strategy 3: Spring Trading
**Setup:**
1. Strong downtrend followed by range
2. Price breaks below range bottom
3. Volume is LOW on breakdown
4. Price quickly reverses and closes above support
**Entry:**
- When candle closes above support level
- Or on retest of support
**Stop Loss:**
- Below spring low (usually tight)
**Target:**
- Top of trading range
- Previous swing high
**Risk/Reward:**
- Typically 1:3 or better
### Strategy 4: Smart Money Tracking
**Setup:**
1. Look for 💰 symbols in demand zones
2. Multiple accumulation signals (PS, SC, ST, Test)
3. Volume decreasing during range
**Entry:**
- At next demand zone test
- On SOS breakout
**Confirmation:**
- Background turning green (Phase D/E)
- Table shows "BULLISH" bias
### Strategy 5: VSA Reversal
**Setup:**
1. Strong trend in place
2. Stopping Volume (SV) appears at extreme
3. Followed by No Demand (ND) or No Supply (NS)
**Entry:**
- When trend breaks down/up
- On retest of extreme
**Example (Bullish):**
```
Downtrend → Stopping Volume → No Supply → Up bar
Entry: Buy when price moves above SV bar
```
---
## SETTINGS & CUSTOMIZATION
### Volume Analysis Settings
**Volume MA Length** (default: 20)
- Shorter = More sensitive to volume changes
- Longer = Smoother, less noise
- Recommended: 15-25 for most timeframes
**High Volume Multiplier** (default: 1.5)
- Threshold for "high volume"
- Lower = More signals
- Higher = Only extreme volume
- Recommended: 1.3-2.0
**Climax Volume Multiplier** (default: 2.0)
- Threshold for climax events (SC, BC)
- Should be significantly higher than normal
- Recommended: 2.0-3.0
### Phase Detection Settings
**Swing Detection Length** (default: 5)
- How many bars to look left/right for swing points
- Shorter = More swings detected (more noise)
- Longer = Fewer swings (cleaner, might miss some)
- Recommended: 3-7
**Range Expansion Threshold** (default: 1.5)
- Multiplier for "wide spread" bars
- Higher = Only very wide bars qualify
- Recommended: 1.3-2.0
**Volume Confirmation** (default: ON)
- Requires volume confirmation for events
- Turn OFF for very low volume instruments
- Keep ON for stocks, forex, crypto
### Display Options
Toggle on/off:
- ✅ **Show Accumulation/Distribution Phases** - Background colors
- ✅ **Show Wyckoff Events** - All labeled events
- ✅ **Show Volume Spread Analysis** - VSA labels
- ✅ **Show Supply/Demand Zones** - Boxes on chart
- ✅ **Show Composite Operator Signals** - 💰 symbols
### Color Customization
- **Bullish Color** - All accumulation events
- **Bearish Color** - All distribution events
- **Neutral Color** - Range/neutral signals
---
## ALERT SETUP
### Available Alerts
1. **Selling Climax (SC)** - Potential bottom forming
2. **Spring** - Strong buy signal
3. **Sign of Strength (SOS)** - Bullish breakout
4. **Buying Climax (BC)** - Potential top forming
5. **UTAD** - Strong sell signal
6. **Sign of Weakness (SOW)** - Bearish breakdown
7. **Phase E Markup** - Uptrend confirmed
8. **Phase E Markdown** - Downtrend confirmed
9. **Smart Money Accumulation** - Institutions buying
10. **Smart Money Distribution** - Institutions selling
### How to Set Up Alerts
1. Click the "⏰" icon on TradingView
2. Select "Create Alert"
3. Condition: Choose the indicator and alert type
4. Example: "Wyckoff Method - Spring"
5. Set notification preferences (popup, email, webhook)
6. Click "Create"
### Recommended Alert Strategy
**Conservative Trader:**
- Spring
- SOS
- UTAD
- SOW
**Aggressive Trader:**
- Add: SC, BC, Smart Money signals
**Long-term Investor:**
- Phase E Markup
- Phase E Markdown
- Smart Money Accumulation
---
## COMMON PATTERNS
### Pattern 1: Classic Accumulation
```
Phase A: Downtrend → PS → SC → AR → ST
Phase B: Range building (4-12 weeks typical)
Phase C: Spring (false breakdown)
Phase D: SOS → LPS → BU
Phase E: Markup (new uptrend)
```
**What to do:**
- Mark the range boundaries
- Wait for spring
- Buy on LPS or SOS
- Hold through markup
### Pattern 2: Classic Distribution
```
Phase A: Uptrend → PSY → BC → AR → ST
Phase B: Range building (topping process)
Phase C: UTAD (false breakout)
Phase D: SOW → LPSY
Phase E: Markdown (new downtrend)
```
**What to do:**
- Mark the range boundaries
- Wait for UTAD
- Sell on LPSY or SOW
- Stay out during markdown
### Pattern 3: Re-Accumulation
```
Uptrend → Trading Range → Spring → Uptrend continues
```
- Occurs during existing uptrend
- Shorter accumulation period
- Often no clear SC (trend is already up)
- Spring is the key signal
### Pattern 4: Re-Distribution
```
Downtrend → Trading Range → UTAD → Downtrend continues
```
- Occurs during existing downtrend
- Shorter distribution period
- Often no clear BC (trend is already down)
- UTAD is the key signal
### Pattern 5: Failed Breakout
**Bullish Failed Breakout:**
```
Range → Breakdown → Immediate reversal (Spring)
```
- Price breaks support
- Volume is LOW
- Immediate strong reversal
- Very bullish
**Bearish Failed Breakout:**
```
Range → Breakout → Immediate reversal (UTAD)
```
- Price breaks resistance
- Volume may be high initially
- Quick rejection and reversal
- Very bearish
---
## TIMEFRAME RECOMMENDATIONS
### Daily Charts (Most Reliable)
- Best for swing trading
- Clear phases and events
- Less noise
- Recommended for beginners
### 4-Hour Charts
- Good for active swing traders
- Faster signals than daily
- Still reliable
### 1-Hour Charts
- For day traders
- More false signals
- Need to filter carefully
- Use in conjunction with higher timeframe
### 15-Minute / 5-Minute
- Only for experienced traders
- High noise level
- Many false signals
- Use daily chart for context
**Golden Rule:** Always check higher timeframe first!
---
## MULTI-TIMEFRAME ANALYSIS
### Top-Down Approach (Recommended)
1. **Weekly Chart** - Identify major trend and phase
2. **Daily Chart** - Find current accumulation/distribution
3. **4H Chart** - Identify entry timing
4. **Entry Timeframe** - Execute trade
### Example Analysis:
**Weekly:** Phase E Markup (bullish)
**Daily:** Phase B Re-accumulation
**4-Hour:** Spring detected
**Action:** Buy on daily LPS
---
## WYCKOFF + OTHER INDICATORS
### Complementary Tools
1. **Moving Averages**
- 20/50 SMA for trend context
- Already plotted on indicator
2. **RSI**
- Divergences at SC/BC
- Confirms overbought/oversold
3. **MACD**
- Confirms trend change in Phase D
- Divergences support Wyckoff events
4. **Volume Profile**
- Identifies value areas
- Confirms supply/demand zones
5. **Order Flow / Footprint Charts**
- See institutional activity
- Confirms smart money signals
**Don't Over-Complicate:**
- Wyckoff is a complete system
- Other indicators are supplementary
- When in doubt, trust Wyckoff
---
## TROUBLESHOOTING
### Issue: Too Many Labels
**Solution:**
- Increase swing length (Settings → 7 or 10)
- Increase volume multipliers
- Turn off VSA labels if not needed
- Focus on major events only (SC, Spring, SOS, BC, UTAD, SOW)
### Issue: Missing Expected Events
**Solution:**
- Decrease swing length (Settings → 3)
- Decrease volume multipliers
- Turn OFF volume confirmation
- Check timeframe (use daily chart)
### Issue: False Signals
**Solution:**
- Use higher timeframe
- Wait for confirmation
- Don't trade against major trend
- Look for multiple signal convergence
### Issue: Can't See Background Colors
**Solution:**
- Check "Show Phases" is enabled
- Increase monitor brightness
- Colors are subtle by design (not to obscure price)
### Issue: Volume Shows Incorrectly
**Solution:**
- Ensure volume data is available for your symbol
- Some symbols have poor volume data
- Forex spot pairs have no real volume
- Use futures or stock markets for best results
### Issue: No Trading Range Detected
**Solution:**
- Market may be trending strongly
- Trading range might be too small
- Wait for price to consolidate
- Not all markets have clear ranges
---
## ADVANCED TIPS
### 1. Count Point & Figure Charts
- Wyckoff used P&F to measure "cause"
- Width of range × height = minimum move target
- Longer accumulation = larger markup
### 2. Watch for Absorption
- High volume + narrow spread = someone absorbing
- In downtrend = accumulation
- In uptrend = distribution
### 3. Multiple Timeframe Springs
- Spring on daily + spring on weekly = very strong
- Increases probability significantly
### 4. Failed Signals Are Signals Too
- Failed spring = weakness, expect lower
- Failed UTAD = strength, expect higher
### 5. Context is King
- Don't buy during Phase E Markdown
- Don't sell during Phase E Markup
- Respect the major trend
### 6. Volume Precedes Price
- Study volume changes first
- Price follows volume
- Decreasing volume in range = building energy
### 7. Composite Operator Mindset
- Think like institutions
- Where would smart money buy/sell?
- They need liquidity (retail traders)
---
## RISK MANAGEMENT
### Position Sizing
**Conservative:**
- Risk 1% per trade
- Wider stops at range boundaries
**Moderate:**
- Risk 1-2% per trade
- Stops below spring/above UTAD
**Aggressive:**
- Risk 2-3% per trade
- Tight stops
- Higher win rate needed
### Stop Loss Placement
**Accumulation:**
- Below spring low
- Below trading range bottom
- Below demand zone
**Distribution:**
- Above UTAD high
- Above trading range top
- Above supply zone
### Take Profit Strategy
**Method 1: Measured Move**
- Range height = minimum target
- 2x range height = extended target
**Method 2: Fibonacci Extensions**
- 1.0 = range height
- 1.618 = extended target
- 2.618 = maximum target
**Method 3: Trail the Stop**
- Move stop to breakeven at 1R
- Trail under swing lows in markup
- Lock in profits progressively
---
## BACKTESTING CHECKLIST
Before trading with real money:
- Backtest on 50+ historical examples
- Record all signals in trading journal
- Calculate win rate (aim for >50%)
- Calculate average R:R (aim for >1:2)
- Test on multiple instruments
- Test on multiple timeframes
- Test in different market conditions
- Verify signal consistency
- Practice on demo account
- Start small with real money
---
## RECOMMENDED READING
### Books
1. **"Studies in Tape Reading"** - Richard D. Wyckoff
2. **"The Richard D. Wyckoff Method"** - Rubén Villahermosa
3. **"Charting the Stock Market: The Wyckoff Method"** - Jack Hutson
4. **"Master the Markets"** - Tom Williams (VSA)
### Courses
1. Wyckoff Analytics - Official Wyckoff course
2. TradeVSA - Volume Spread Analysis
3. StockCharts - Wyckoff education
### Communities
1. Wyckoff Analytics Forum
2. Reddit r/Wyckoff
3. TradingView Wyckoff ideas section
---
## FREQUENTLY ASKED QUESTIONS
**Q: Can I use this on crypto?**
A: Yes, works well on major cryptocurrencies with good volume.
**Q: Does it work on forex?**
A: Yes, but use futures volume (like 6E for EUR/USD) for better accuracy.
**Q: What's the best timeframe?**
A: Daily chart for most traders. 4H for more active trading.
**Q: How long does accumulation last?**
A: Typically 2-12 weeks. Longer accumulation = bigger markup.
**Q: Can I automate this?**
A: You can use the alerts, but manual analysis is recommended.
**Q: What's the win rate?**
A: With proper filtering: 60-70% on major signals (Spring, UTAD, SOS, SOW).
**Q: Should I trade every signal?**
A: No. Focus on Spring, UTAD, SOS, and SOW in trending markets.
**Q: What if I see conflicting signals?**
A: Use higher timeframe for context. When in doubt, stay out.
**Q: How do I know which phase I'm in?**
A: Check the table in top-right corner. Also look at background color.
**Q: Can I use this for options trading?**
A: Yes, excellent for timing option entries (especially around Spring/UTAD).
---
## FINAL THOUGHTS
The Wyckoff Method is:
- **A complete trading system** (not just an indicator)
- **Based on 100+ years** of market wisdom
- **Used by institutions** and professional traders
- **Requires practice** and screen time
- **Highly effective** when applied correctly
**Success Tips:**
1. Start with daily charts
2. Focus on major events (SC, Spring, SOS, BC, UTAD, SOW)
3. Always check higher timeframe context
4. Wait for confirmation before entering
5. Manage risk properly
6. Keep a trading journal
7. Be patient - wait for the best setups
**Remember:**
- Not every range will have all events
- Some phases may be abbreviated
- Context and confluence matter most
- Practice makes perfect
---
## SUPPORT & UPDATES
For questions, improvements, or bug reports:
- Check TradingView script comments
- Join Wyckoff trading communities
- Study historical examples
- Practice on demo accounts
**Good luck and happy trading!**
---
*Disclaimer: This indicator is for educational purposes. Always do your own analysis and risk management. Past performance does not guarantee future results.*
# WYCKOFF VISUAL SETUP EXAMPLES
## ACCUMULATION SCHEMATIC #1 (Classic Bottom)
```
Price Chart View:
│ PHASE E
│ MARKUP
│ ╱
│ ╱
┌─SOS─────┤ ╱
│ │ ╱
┌───────────┤ ┌LPS │╱
│ PHASE B │ │ │
│ (Cause) └──┴──────┤
┌AR──┤ │
┌────┤ │ ┌─Spring │ PHASE D
│ └ST──┤ │ │
│ │ │ │
────SC────────┴─────────┴───────────┴──────────
│
PS
│ PHASE A
│
Downtrend
```
### PHASE A - Stopping the Downtrend
```
PS: │ High volume down bar
▼ First sign of support
■ Not bottom yet
SC: │ VERY HIGH volume
▼ Panic selling exhaustion
█ Long lower wick
█ This is the low
AR: │ Automatic rally
▲ Relief bounce
■ High volume acceptable
ST: │ Secondary test
▼ Low volume (KEY!)
■ Tests SC low
```
### PHASE B - Building the Cause
```
┌─────────┐
│ ~~~ │ Multiple tests
│ ~ ~ │ Volume decreases
│~ ~ │ Range gets tighter
└─────────┘
Duration: 2-12 weeks typical
The longer, the bigger the eventual move
```
### PHASE C - The Test (SPRING)
```
║ False breakdown
─────╨─────
▼ Low volume
█ Breaks below support
■
█ Quick reversal
▲ Closes ABOVE support
CRITICAL: Volume must be LOW
Close must be strong
Happens quickly (1-3 bars)
```
### PHASE D - Strength Emerges
```
SOS: ▲ Sign of Strength
────╥──── Break above resistance
║ High volume
║ Wide spread
LPS: ▼ Last Point Support
■ Pullback on LOW volume
▲ Great entry point
BU: ▲ Backup
■ Final consolidation
▲ Before markup
```
### PHASE E - Markup
```
╱
╱
╱ Strong uptrend
╱ High momentum
╱ Can last months/years
──╱──
```
---
## DISTRIBUTION SCHEMATIC #2 (Classic Top)
```
Price Chart View:
Uptrend
│
PSY
│ PHASE A
────BC────────┬─────────┬───────────┬──────────
│ │ UTAD │
│ PHASE B │ │ PHASE D
┌AR──┤ ┌LPSY │ │
│ │ │ └───────────┤
│ └──┴──────┐ │╲
└ST──┤ │ │ ╲
│ └───────────┤ ╲
└─SOW─────┤ │ ╲
│ │ ╲
│ PHASE C │ ╲
│ │ PHASE E
│ │ MARKDOWN
```
### PHASE A - Stopping the Uptrend
```
PSY: │ High volume up bar
▲ Preliminary supply
■ Selling starting
BC: │ VERY HIGH volume
▲ Buying climax
█ Euphoric top
█ Long upper wick
AR: │ Automatic reaction
▼ Sharp selloff
■ High volume
ST: │ Secondary test
▲ Low volume (KEY!)
■ Tests BC high
```
### PHASE C - The Test (UTAD)
```
▲ False breakout
────╥────
║ Breaks ABOVE resistance
║ Often high volume spike
▼
█ Rejection / weak close
█ Closes BELOW resistance
▼
CRITICAL: Closes weak
Quick rejection
Traps buyers
```
### PHASE D - Weakness Emerges
```
SOW: ▼ Sign of Weakness
────╨──── Break below support
║ High volume
║ Wide spread
LPSY: ▲ Last Point Supply
■ Rally on LOW volume
▼ Last chance to exit
```
---
## VOLUME PATTERNS (Critical to Understanding)
### ACCUMULATION Volume Pattern
```
Volume
│ SC
█
█ ST
■ ■ Spring
■ ■ ■ SOS LPS
──┴────┴────┴──────█───■────►
│ │ │ │ │
│ │ │ │ │
A A C D D
Pattern: HIGH → low → low → HIGH → low
Key: Volume DECREASES during range
INCREASES on breakout
```
### DISTRIBUTION Volume Pattern
```
Volume
│ BC
█
█ ST
■ ■ UTAD
■ ■ ■ SOW LPSY
──┴────┴────┴──────█───■────►
│ │ │ │ │
│ │ │ │ │
A A C D D
Pattern: HIGH → low → varies → HIGH → low
Key: Volume MAY increase on UTAD
Definitely HIGH on breakdown (SOW)
```
---
## REAL TRADE SETUPS
### Setup #1: SPRING BUY
```
Entry Conditions:
1. Clear trading range identified
2. Price breaks BELOW support
3. Volume is LOW (critical!)
4. Price reverses QUICKLY
5. Closes ABOVE support level
Entry: Next bar or on retest
Stop: Below spring low
Target: Top of range (minimum)
Example:
Support: $100
Spring low: $98 (low volume)
Close: $101
Entry: $102
Stop: $97.50
Target: $120 (range top)
Risk/Reward: 1:4
```
### Setup #2: UTAD SELL
```
Entry Conditions:
1. Clear trading range identified (after uptrend)
2. Price breaks ABOVE resistance
3. Often high volume spike
4. Price reverses QUICKLY
5. Closes BELOW resistance level
Entry: Next bar or on retest
Stop: Above UTAD high
Target: Bottom of range (minimum)
Example:
Resistance: $200
UTAD high: $205 (spike)
Close: $198
Entry: $197
Stop: $206
Target: $180 (range bottom)
Risk/Reward: 1:2
```
### Setup #3: SOS BREAKOUT
```
Entry Conditions:
1. Clear accumulation range
2. Spring already occurred (ideal)
3. Price breaks ABOVE resistance
4. HIGH volume on breakout
5. Wide spread up bar
Entry Option A: On breakout ($120)
Entry Option B: Wait for LPS pullback ($115)
Stop: Below range or LPS
Target: Range height projected up
Example:
Range: $100-$120 (20 points)
SOS breakout: $120
Entry A: $120
Stop: $115
Target 1: $140 (100%)
Target 2: $150 (150%)
```
---
## VSA SPECIFIC PATTERNS
### Pattern 1: No Demand (Weakness)
```
▲
■ Up bar
■ Low volume ◄── KEY
▲ Small body
Context: After uptrend
Meaning: Buyers exhausted
Action: Prepare to sell
```
### Pattern 2: No Supply (Strength)
```
▼
■ Down bar
■ Low volume ◄── KEY
▼ Small body
Context: After downtrend
Meaning: Sellers exhausted
Action: Prepare to buy
```
### Pattern 3: Stopping Volume
```
═ Very high volume
█ Narrow spread ◄── KEY
═ Price not moving
Context: At extremes
Meaning: Absorption
Action: Expect reversal
```
---
## COMMON MISTAKES (What NOT to Do)
### ❌ Mistake 1: Buying Prematurely
```
WRONG:
SC
▼
█ ← DON'T BUY HERE
CORRECT:
Spring
─────╨─────
▼
█ ← BUY HERE
▲
```
### ❌ Mistake 2: Ignoring Volume
```
WRONG: "It broke below support, must be spring"
─────╨───── High volume
█
This is a BREAKDOWN, not a spring!
CORRECT Spring:
─────╨───── LOW volume ✓
■ Quick reversal ✓
▲
```
### ❌ Mistake 3: Trading Against Trend
```
WRONG:
Markdown Phase E
╲
╲ ← Trying to buy here
╲
╲
CORRECT:
Wait for new accumulation to complete
```
---
## MULTI-TIMEFRAME EXAMPLE
### Weekly Chart: Phase E Markup (Bullish)
```
╱
╱
╱ Long-term uptrend
╱
───╱─────
```
### Daily Chart: Re-Accumulation Phase C
```
┌─────────┐
│ Spring │ ← We are here
│ ▼ │
─────┴────█────┴─────
▲
```
### 4-Hour Chart: Entry Timing
```
Last 48 hours:
─────╨───── Spring occurred
█
▲ ← Enter now
■
```
**Result:** Triple confirmation across timeframes = High probability trade
---
## PROFIT TARGETS (Visual Guide)
### Method 1: Basic Measured Move
```
Resistance: 120 ┐ ─────────
│
│ 20 points
│
Support: 100 ┘ ─────────
Breakout: 120
Target: 120 + 20 = 140
╱╱╱ 140 (Target)
╱╱╱
╱╱╱
──────◄ 120 (Breakout)
│
Range │ 20
│
──────┘ 100
```
### Method 2: Multiple Targets
```
╱╱╱ 150 (Target 3: 2.5x) - 20% position
╱╱╱
╱╱╱ 140 (Target 2: 2x) - 30% position
╱╱╱
─────◄╱ 130 (Target 1: 1x) - 50% position
│
10 │ 120 (Breakout)
│
─────┘ 110 (Support)
```
### Method 3: Trailing Stop
```
1. Move stop to breakeven at Target 1
2. Trail stop under swing lows
3. Let winners run
╱╱╱
╱ ╱╱ ← Trail stop here
╱╱ ╱
╱ ╱ ← Then here
─────◄──╱
← Start here (breakeven)
```
---
## TIMING ENTRIES (Exact Bar Patterns)
### Perfect Spring Entry
```
Bar 1: ▼ Breaks below (Low vol)
█
Bar 2: ▲ Reverses (Closes strong)
█ ◄─ ENTER HERE
Bar 3: ■ Confirms
▲
DON'T WAIT for Bar 3!
Enter on Bar 2 close
```
### Perfect UTAD Entry
```
Bar 1: ▲ Breaks above (Spike vol OK)
█
Bar 2: ▼ Reverses (Closes weak)
█ ◄─ ENTER HERE
Bar 3: ■ Confirms
▼
SHORT on Bar 2 close
Don't wait for more confirmation
```
---
## COMPOSITE OPERATOR PSYCHOLOGY
### What Smart Money Does (Follow Them)
**Accumulation:**
```
1. Create fear (PS, SC)
2. Shake out weak hands (Spring)
3. Absorb supply quietly (Phase B)
4. Test for remaining supply (Test)
5. Mark it up (SOS → Phase E)
💰 They buy LOW when retail panics
```
**Distribution:**
```
1. Create euphoria (PSY, BC)
2. Trap late buyers (UTAD)
3. Distribute to buyers (Phase B)
4. Test for remaining demand (ST)
5. Mark it down (SOW → Phase E)
💰 They sell HIGH when retail buys
```
### Where to Look for Smart Money
```
💰 Buy signals appear at:
- Demand zones (green boxes)
- Springs and shakeouts
- Tests of support
- After selling climax
💰 Sell signals appear at:
- Supply zones (red boxes)
- UTAD and upthrusts
- Weak rallies (LPSY)
- After buying climax
```
---
## PRACTICE EXERCISES
### Exercise 1: Identify the Phase
Look at any chart and ask:
1. Is there a trading range? (Phase B likely)
2. Did we just stop a trend? (Phase A)
3. Was there a spring/UTAD? (Phase C)
4. Is there a breakout? (Phase D)
5. Is trend running? (Phase E)
### Exercise 2: Volume Analysis
For each bar, note:
- Volume level (High/Normal/Low)
- Spread (Wide/Normal/Narrow)
- Effort vs Result (Matching? Diverging?)
### Exercise 3: Find Historical Springs
Go back 6 months:
- Mark all springs you can find
- Note the setup before each
- Track what happened after
- Calculate win rate
---
## FINAL VISUALIZATION: The Complete Cycle
```
ACCUMULATION → MARKUP → DISTRIBUTION → MARKDOWN → ACCUMULATION...
Distribution Accumulation
(Top) (Bottom)
┌───────────────┐ ┌───────────────┐
│ BC UTAD │ │ Spring SC │
│ │ │ │ │ │ │ │
────┴───┴───┴───────┴─╲ ╱────────┴───┴───┴────
╲ ╱
Markdown ╲ ╱ Markup
(Phase E) ╲ ╱ (Phase E)
╲ ╱
╲ ╱
╲ ╱
╲ ╱
V
The market cycles endlessly
Your job: Identify where you are in the cycle
Trade accordingly
```
---
**Remember:**
- 📊 Study charts daily
- 📝 Journal every setup
- 🎯 Wait for the best signals
- 💰 Follow smart money
- ⏰ Be patient
- 🚀 Let winners run
**The indicator does the heavy lifting - you make the decisions!**

NeoChartLabs POCOne of our Favorite Indicators - the High Time Frame Point of Control with a Volume Profile.
Shout out to p2pasta for the original script, we updated to v6.
Currently included: Monthly, 3 months and 6 months.
/* DEFINITION */
Point Of Control (= POC) is a price level at which the heaviest volumes were traded.
Value Area High/Low (=VAH/VAL) is a range of prices where the majority of trading volume took place. Naturally, Value Area High being the top price level and Value Area Low being the lowest. POC always is between the two.
/* HOW TO TRADE WITH THIS INDICATOR */
The basis for POC is determining bias on whichever timeframe you choose.
1. Identify a POC on the timeframe of your choosing.
/* If you choose a "low" timeframe (monthly here) then make sure to look at the higher timeframes to see how it is playing against a higher timeframe POC.
2. When the price is moving away from the POC (either to the upside or downside) this will confirm or invalidate the trade.
3. You can now enter the trade on bias or wait for a retest of the same POC.

DAF VP Lite 「DAF Poker Model」🎁 Volume Profile Indicator – Provided for free by DAF Poker Model
DAF VP Lite is a lightweight volume profile indicator that helps you identify key price levels where significant trading activity occurred.
📍 Core Features:
• POC (Point of Control) – The price level with the highest volume
• VAH/VAL (Value Area High/Low) – Boundaries of 70% of total volume
• IB (Initial Balance) – Opening range reference
📊 Multi-Timeframe Support:
Day / Week / Month / Quarter / Half-Year / Year
━━━━━━━━━━━━━━━━━━━━━━━━━━━━━━━━━━━━━━━━━━━
🎁 由 DAF Poker Model 免费提供的成交量分布指标
DAF VP Lite 是一款轻量级成交量分布指标,帮助你识别主力成交密集的关键价格区域。
📍 核心功能:
• POC(成交量控制点)- 成交量最集中的价格
• VAH/VAL(价值区间)- 覆盖 70% 成交量的上下边界
• IB(初始平衡区间)- 开盘博弈区参考
📊 多周期支持:
天 / 周 / 月 / 季度 / 半年 / 年
AlphaNatt | FINAL REVELATION [Visual God]AlphaNatt | The Final Revelation
"Where Information Theory meets Market Geometery."
The AlphaNatt is a comprehensive market structure and volumetric analysis suite designed for the institutional-grade trader. It merges advanced quantitative concepts—specifically Shannon Entropy and Neural Pattern Filtering—with a "Holographic" visual interface that prioritizes clarity over clutter.
This is not just an indicator; it is a complete decision-support system that answers three critical questions:
Is the market chaotic or ordered? (Entropy Engine)
Where is the liquidity? (Volumetric Heatmap)
What is the true structure? (Fractal Geometry)
🌌 The Gen 100 Math Engine
At the core of this script lies a unique implementation of Information Theory.
1. Shannon Entropy (The Chaos Filter)
Most indicators fail because they try to predict "Noise". This script calculates the Entropy (in Bits) of the recent price action.
High Entropy: The market is in a "Random Walk" state. Visuals fade out, transparency increases, and signals are suppressed.
Low Entropy: The market is "Ordered" and approaching a singularity/decision point. Visuals glow brightly to indicate a high-probability environment.
2. Neural Pattern Recognition
The diamond signals (Cyan/Magenta) are not simple simple crossovers. They are driven by a composite logic simulating a neural filter:
Inputs: Normalised RSI + Momentum Divergence + Volatility State.
Logic: Signals only trigger when the market is statistically overextended AND showing signs of momentum decay.
💎 Holographic Features
🔥 Volumetric Heatmap
The script scans historical price action to build a Volume Profile Heatmap on the right side of the chart.
Purple/Blue Zones: These represent High Volume Nodes (HVNs). These act as "Gravity Wells" for price—often stopping trends or acting as launchpads for reversals.
POC (Point of Control): The bright green line indicates the price level with the absolute highest volume in the lookback period.
🌀 Fractal Structure Lines
Price action is often noisy. The script uses a Fractal Pivot Algorithm (Length 5) to identify the "True Highs" and "True Lows".
It connects these points with dashed "Neural Lines" to show the naked market skeleton.
This instantly reveals if you are in a trend of Higher Highs or a breakdown of Lower Lows.
🖥️ The Heads-Up Display (HUD)
A minimalist dashboard keeps you informed of the math underneath:
ENTROPY: The raw bit-score of market chaos.
REGIME: Tells you instantly if you are in "ORDER" (Tradeable) or "CHAOS" (Sit out).
STRUCT: Real-time status of the fractal structure (Breakout/Breakdown/Ranging).
⚙️ Settings & Configuration
Theme: Choose between "Cyber" (Neon), "Aeon" (Deep Blue), or "Gold" (Luxury).
Max Entropy: Adjust the sensitivity of the Chaos Filter. Lower values = stricter filtering (fewer trades).
Heatmap Depth: Control how far back the volume profile scans.
⚠️ Disclaimer
This tool is designed for educational market analysis. "Entropy" and "Neural" refer to the mathematical algorithms used to process price data and do not guarantee future performance. Always manage risk responsible.

Opening Range & Session Liquidity [LTS]“Opening Range & Session Liquidity ” is an intraday planning tool that combines a configurable Opening Range box with session highs/lows and previous-day reference levels. It is designed to help you visualize where liquidity is likely to build up around the cash open and major global sessions, without making any forecasts or performance promises. It is designed with our signature attention to user customization and accessibility.
Opening Range & Bias
The script builds a configurable Opening Range (OR) in New York time (default 08:00–08:15 on a 15-minute basis), regardless of your chart timeframe (up to 1-hour). The high, low, and midline of this window are drawn as a transparent box and dashed midline that extend forward so you can see how the session trades around that range.
At a user-defined Bias Check Time (default 09:30–09:31 NY), the script classifies the OR as:
Bullish if price is above the OR high
Bearish if price is below the OR low
Neutral if price is still trading inside the OR
The box color updates to reflect the current bias if bias mode is enabled. All OR parameters (formation window, bias check, colors, maximum number of zones, etc.) are adjustable.
Entry Signal Logic
The indicator can optionally generate non-repainting visual signals when price interacts with the OR midline.
1. 9:30 Bias mode (trend-following)
A directional bias is locked in at the bias check time.
Signals trigger only when price trades through the OR midline inside the box, aligned with that bias:
Bullish bias → long signal when price touches the midline from below and closes inside the range.
Bearish bias → short signal when price touches the midline from above and closes inside the range.
Each “episode” can fire only once; signals are confirmed on the bar where the conditions first become true.
2. Entry Direction mode (reaction to first touch)
Instead of using a fixed 9:30 bias, the script detects from which side price first enters the OR (from above or from below).
That “entry direction” stays active until price fully exits and closes outside the OR again.
When price later touches the midline while the entry direction is defined, a single long or short signal is triggered based on the stored direction of entry.
In both modes, historical signals are plotted without using future data; only the real-time bar can change state until it closes.
Optional TP/SL Visualization
When a long or short signal appears, the script can draw simple take-profit/stop-loss boxes to illustrate a basic one-trade idea:
Stop-loss distance can be defined as:
A fixed number of points beyond the OR high/low, or
A percentage of ATR (configurable length and percent).
Take-profit is automatically placed at a user-defined risk-to-reward multiple of that stop distance.
The boxes extend forward bar by bar and stop updating once either TP or SL is touched, or when a new OR session resets the context.
These boxes are for visualization only and do not place or manage orders.
Session Liquidity & PDH/PDL
To help you map where liquidity frequently builds up, the script tracks three configurable intraday sessions in New York time:
Asian session (default 18:00–02:00)
London session (default 03:00–08:00)
New York session (default 09:30–16:00)
For each completed session, the indicator records the session high and low, then:
Draws solid horizontal lines and labels (e.g., “Asia Hi/Lo”, “London Hi/Lo”, “NY Hi/Lo”).
Extends these solid lines to the right as long as they remain untouched by price.
When price first trades through a level, the solid line is cut at that bar and replaced by a dashed line that extends only until the next session of the same type begins.
Older sessions are automatically removed according to the “Max Sessions to Display” setting to reduce chart clutter.
In addition, the indicator plots:
Previous Day High (PDH) & Previous Day Low (PDL)
Previous Day Point of Control (PDPoC) – an approximate volume-weighted price computed from intraday data using a simple binning approach on a user-chosen lower timeframe.
Like the session levels, PDH/PDL/PDPoC start as solid lines. After the first touch, each level switches to a dashed style and continues only until the following trading day, at which point the previous day’s dashed lines are stopped and new levels are created.
Info Table & Multi-Timeframe Logic
An optional on-chart info table summarizes the most recent Opening Range:
OR high, low, and midline
Current OR range in points
Active mode (9:30 Bias vs. Entry Direction)
Current bias or entry-direction status
Whether a signal is “Waiting”, “Armed”, or “Triggered”
Whether the OR was built from the chart timeframe or from a 15-minute higher-timeframe feed
If your chart timeframe is higher than the OR calculation timeframe, the script automatically uses multi-timeframe data to build a consistent OR, while enforcing a maximum chart timeframe of 1-hour for reliability.
How to Use This Tool
Use the OR box and bias to define your primary intraday context around the cash open.
Use session highs/lows and PDH/PDL/PDPoC as objective reference levels for where price may react or where stops and liquidity might cluster.
Treat the signal markers and TP/SL boxes as visual guides only. They can help you structure trade ideas, but they are not a trading system by themselves.
Always confirm levels and signals with your own analysis, risk management, and execution rules.
Limitations & Notes
The script is intended for intraday charts up to 1-hour. By the nature of the information being displayed, any time frame above that may result is undesirable visual clutter.
The POC calculation is an approximation based on lower timeframe bar-level volume and binning; it is not a tick-by-tick volume profile.
Signals and levels update in real time on the current forming bar. Once a bar closes, completed historical signals do not repaint, but the last live bar can change until it closes.
The indicator does not use lookahead or offset plotting into the past; it is not designed to predict the future or guarantee any particular trading result.
Always test settings on a demo environment first and manage risk according to your own plan.

[CASH] Crypto And Stocks Helper (MultiPack w. Alerts)ATTENTION! I'm not a good scripter. I have just learned a little basics for this project, stolen code from other public scripts and modified it, and gotten help from AI LLM's.
If you want recognition from stolen code please tell me to give you the credit you deserve.
The script is not completely finished yet and contains alot of errors but my friends and family wants access so I made it public.
_________________________________________________________________________________
CASH has multiple indicators (a true all-in-one multipack), guides and alerts to help you make better trades/investments. It has:
- Bitcoin Bull Market Support Band
- Dollar Volume
- 5 SMA and 5 EMA
- HODL Trend (a.k.a SuperTrend) indicator
- RSI, Volume and Divergence indicators w. alerts
More to come as well, like Backburner and a POC line from Volume Profile.
Everything is fully customizable, appearance and off/on etc.
More information and explainations along with my guides you can find in settings under "Input" and "Style".

VWAP and IVP Volatility Screener AlertVWAP and IVP Volatility Screener Alert is a multi-asset, institutional-grade market scanner that combines Auto-Anchored VWAP, Implied Volatility Percentile (IVP), Choppiness Index, Strike Price Structure, and Volume Profile (POC / Value Area) to generate high-probability trade signals across multiple symbols.
Designed for traders who rely on volatility regimes, VWAP interactions, trend confirmation, and strike-based price behavior, this tool automatically evaluates up to 10 assets simultaneously and displays actionable BUY/SELL conditions in a unified dashboard and screener panel.
Key Features
1. Multi-Asset Screener (10 Symbols)
Scans FX, indices, commodities, and metals. Displays RSI, ADX, trend, score, volatility regime, VWAP/POC/Value Area position, IVP, and Choppiness. Custom strike increments per asset.
2. Auto-Anchored VWAP System
Auto anchors by Session, Day, Week, Month, or Auto. Includes VWAP bands and bounce detection to show when price is Above, Below, or interacting with VWAP.
3. Volume Profile + POC / Value Area
Generates intraday/session POC, VAH, and VAL. Detects breaks, retests, and bounce signals.
4. IV Percentile (IVP) Engine
Converts realized volatility into IVP and classifies regimes (EXT.HI → EXT.LO). Supports Favorable, Extreme, and High-Volatility modes for different trading styles.
5. Choppiness Index (CHOP)
Identifies trending vs ranging conditions and feeds directly into scoring and alerts.
6. 11-Criteria Alert System
Alert logic includes RSI, ADX, trend, volume, VWAP, POC/VA, strike proximity, std-dev breaks, IVP, CHOP, and score thresholds. Supports Score-Based or Multi-Criteria modes.
7. Price-to-Strike Mapping
Rounds price to the correct strike ladder, detecting reversals, continuation, breakout levels, and helping frame stop-loss/TP zones.
8. Session-Aware Filtering
Filters signals for Asian, London, and NY sessions with custom timezone support.

Volume Scope Pro - Order Flow Volume Analysis V1.01Volume Scope Pro — Order Flow Volume Analysis
Overview
Volume Scope Pro is a multi-faceted volume analysis indicator that separates volume into buy (up) and sell (down) components to reveal hidden order flow dynamics. It aggregates lower timeframe volume data to estimate buying vs. selling pressure on each bar, calculates the volume delta (buy volume minus sell volume) per bar, and highlights where price action diverges or converges with volume flow. The indicator provides visual output in the form of an on-chart table and chart markers, helping traders identify potential distribution (selling into strength) and absorption (buying into weakness) events, as well as support/resistance zones derived from volume extremes.
Volume Settings
• Global Volume Period – An integer (default 100) defining the shared lookback window (in bars) for all volume-based calculations. This period is used for identifying volume extrema and computing cumulative volume statistics. A larger period considers more history for averages and sums, while a smaller period focuses on recent bars.
• Use Custom Lower Timeframe – A boolean (default true) that lets you override the automatic choice of lower timeframe for volume breakdown. If enabled, the indicator will use the specific lower timeframe you provide (see next setting) to fetch intrabar volume data. If disabled, the script chooses a lower timeframe based on the chart’s resolution (for example, 1-second for second charts, 1-minute for other intraday charts, 5-minute for daily charts, etc.).
• Lower Timeframe – A timeframe input (default 15S, i.e. 15-second intervals) specifying the lower interval to request for up/down volume calculation. This is the resolution at which the script breaks each chart bar’s volume into buying vs. selling volume. Fifteen seconds is the default as it provides a fine-grained intrabar look on most charts. This setting only takes effect if Use Custom Lower Timeframe is true; otherwise, it is ignored in favor of the automatic timeframe resolution.
Table Display Settings
• A dropdown option that adjusts the text size used in the on-chart data table (Tiny, Small, Normal, Large, Huge; default: Tiny). The default Tiny setting is selected because many traders use the indicator on mobile devices where screen space is limited. If you are using a larger display such as a laptop, desktop, or tablet, you may increase the font size to your preference for improved readability.
• Table Font Color – A color picker for the table text (default is a shade of blue, #0068e6). All text in the table will be rendered in this color. You can change it to improve contrast against your chart background or personal preference.
• Time Offset (hours) – An integer offset in hours (default 3) applied to the current time display in the table. This shifts the real-time clock readout from UTC by the specified number of hours in the table’s header. For example, setting 0 uses UTC, while a value of 3 (default) shows local time for UTC+3. Negative values are allowed for time zones behind UTC. This does not affect any calculations – it only adjusts the displayed clock for user convenience.
Trend Line & Pivot Settings
• Pivot Left and Pivot Right – Integers (default 5 each) controlling the sensitivity of pivot high/low detection. A pivot high is identified when the price high of a bar is greater than the highs of the Pivot Left bars to its left and Pivot Right bars to its right. Similarly, a pivot low is a bar whose low is lower than the lows of the surrounding bars on its left and right as defined by these values. Smaller values make the pivots more local and frequent, while larger values require more significant swings.
• Pivot Count – An integer (default 5) specifying the number of recent pivot points to track. The indicator will remember up to this many pivot highs and pivot lows each, and use them for drawing trend lines. When the count is exceeded, the oldest pivot points are dropped to focus on the most recent ones.
• Lookback Length – An integer (default 100) defining the number of bars over which trend lines are extended and within which pivot points are considered relevant. Essentially, this is the length of the window (in bars) in which the detected pivots and their connecting trend lines will be shown. Trend lines will start at the beginning of this lookback window and end at the latest bar, updating as new bars form.
• High Trend Line Color / Low Trend Line Color – Color inputs for the drawn trend lines connecting pivot highs and pivot lows, respectively (both default to orange #ff7b00). High trend lines typically slope downwards (connecting recent highs), and low trend lines slope upwards (connecting recent lows). You can change these colors to visually distinguish the two or to fit your chart theme.
• Trend Line Thickness – An integer (default 2) setting the stroke width of the pivot trend lines. Higher values make the lines thicker and more prominent.
• Trend Line Style – A string option (default dashed, options: solid, dashed, dotted) determining the line style for both high and low trend lines. For example, choosing “dotted” will draw the trend lines as a series of dots. This purely affects the appearance and has no impact on calculations.
Support/Resistance (S/R) Zone Settings
• SR Lookback Length – An integer (default 100) that defines how many completed bars are scanned for support/resistance zone detection based on volume extrema. The indicator examines this many bars behind the latest bar (the current bar is excluded to avoid repaint issues) to find extreme buying and selling volume points that form the zones. A larger value means a longer historical window for finding significant volume-based zones.
• Projection Bars – An integer (default 26, range 0–200) specifying how far into the future to extend the S/R zone lines. When set above 0, the horizontal lines marking the zones will project to the right of the latest bar by the given number of bars. This helps anticipate where the zones lie ahead of current price. A value of 0 confines the zone markings to past bars only.
• Resistance Zone Color / Support Zone Color – Color inputs for the drawn zones identified as resistance and support (defaults are red for resistance and teal for support). These colors apply to both the zone’s border lines and its background fill (with adjustable transparency, see below).
• Resistance Line Width / Support Line Width – Integers (default 2 each, range 1–5) setting the line thickness for the top and bottom boundaries of the resistance zone and support zone, respectively. For example, if Resistance Line Width is 3, the drawn lines at the top and bottom of the resistance zone will be thicker than the default.
• Resistance Fill Transparency / Support Fill Transparency – Integers in percentage (default 90 each, range 0–100) controlling the opacity of the colored shading that fills the zone area. 0% means fully opaque (solid color fill), and 100% means fully transparent (no fill color). The default of 90% is very transparent, just lightly coloring the zone area for subtlety. Adjust these to highlight the zones more prominently or to make them nearly invisible, depending on preference.
Overbought/Oversold (OB/OS) Voting Settings
• Enable OB/OS Voting – A boolean (default true) that turns on the overbought/oversold “voting” module. When enabled, the indicator evaluates standard technical indicators (RSI, Stochastic, CCI, etc.) to determine if the market is overbought (OB) or oversold (OS). Each indicator contributes an OB or OS “vote” based on its classic threshold (for example, RSI > 70 is an OB vote, RSI < 30 is OS). The module aggregates these votes to identify consensus extreme conditions.
• Enable Volume Confirmation Filter – A boolean (default true) that requires volume confirmation for OB/OS signals. If enabled, an overbought condition will only be confirmed if there is unusually high sell volume at the same time, and an oversold condition will only confirm with unusually high buy volume. In practice, this means even if indicators vote OB/OS, the script will only mark it as confirmed when volume is spiking in the opposite direction of price (signaling distribution for OB or absorption for OS). This filter helps ensure that OB/OS signals align with significant volume imbalance, indicating potential involvement of larger market participants.
• Enable Dynamic ATR Threshold – A boolean (default true) that adjusts the overbought/oversold trigger threshold dynamically based on volatility (ATR). When true, the voting threshold or confirmation conditions may be eased or tightened depending on recent volatility, as measured by the Average True Range. In higher volatility environments, this can prevent premature OB/OS signals by requiring more extreme indicator readings.
• Enable OB/OS Sync Window – A boolean (default true) that allows an OB or OS condition to remain valid for a short window of bars. If enabled, once an OB or OS state is triggered, it can persist for a user-defined number of bars (see Bars for Hit Sync Window) even if not all indicators remain in agreement every single bar. This helps to capture a cluster of OB/OS signals as one event rather than flickering on and off.
• Volume Average Period – An integer (default 3) specifying how many recent bars of volume to average when determining “unusually high” volume for confirmation. The script calculates the average buy volume and sell volume over this many bars; then the Volume Spike Ratio inputs (below) are applied to decide if current volume is significantly above average. For example, with a period of 3, the buy/sell volume of the last 3 bars are averaged to use as a baseline.
• Minimum Vote Count for OB/OS – An integer (default 3) setting the minimum number of indicators that must agree on overbought or oversold to consider it a valid signal. If fewer than this number signal OB (or OS) at the same time, the condition is ignored. A higher threshold makes the OB/OS signal rarer but more robust (requiring broader agreement among indicators).
• Bars for Hit Sync Window – An integer (default 1) controlling the size of the synchronization window (mentioned above) in bars. If an OB/OS condition is identified, it remains “active” for this many subsequent bars, allowing slightly delayed volume confirmation or indicator agreement to still count as part of the same event. For example, with a value of 2, if an OB signal occurs on one bar and the volume spike confirmation happens on the next bar, the module will treat it as a continuous event and still flag it.
• ATR Adjustment Factor – A float (default 14, step 1.0) used when Dynamic ATR Threshold is enabled. This factor influences how much ATR-based volatility adjustment is applied to the OB/OS vote threshold or confirmation criteria. A larger number might increase tolerance in volatile conditions. (Note: 14 here likely corresponds to an ATR period internally, not a direct multiplier of ATR value. It effectively adjusts sensitivity but does not need frequent change.)
• Overbought: Sell Volume Spike Ratio – A float (default 1.5) that sets the multiple of average sell volume required to confirm an Overbought condition. If the current sell volume is at least this factor times the recent average sell volume (over the Volume Average Period), and indicators are signaling OB, then an Overbought state is confirmed. For instance, the default 1.5 means sell volume must be 150% or more of its average to validate an OB signal. This ensures that an overbought label is only shown when there’s evidence of heavy selling (distribution) accompanying the price being overbought.
• Oversold: Buy Volume Spike Ratio – A float (default 2.0) setting the multiple of average buy volume required to confirm an Oversold condition. With the default 2.0, the current buy volume needs to be at least 200% of its recent average for an OS signal to confirm. This indicates strong buying interest (absorption) when price is in an oversold state. Typically, oversold conditions with significant buy volume could precede upward reversals.
• Source – A price source input (default close) for OB/OS calculations. This is the series value passed into the 20 indicator calculations (RSI, Stoch, etc.). By default it uses closing price, but advanced users can change it (for example, to an HLC3 or other composite) if desired. Generally, leaving it as close is standard.
Indicator Calculations and Logic
Volume Data Aggregation and Delta Calculation
At the core of Volume Scope Pro is the separation of total volume into up-volume (buying) and down-volume (selling) on each bar. This is achieved by requesting lower timeframe data using TradingView’s built-in requestUpAndDownVolume() function. Specifically, for each chart bar, the script gathers volume from a lower timeframe interval (e.g., 15-second bars) that fits within the higher timeframe bar. It sums the volume of all lower-TF sub-bars where price moved up (buy volume) vs. down (sell volume), providing an estimate of how much of the volume was transacted at the ask (buys) versus at the bid (sells). The resulting values are stored as upVolume and downVolume for the current bar, and the volume delta is computed as deltaVolume = upVolume – downVolume. By default, the script ensures upVolume and downVolume are treated as absolute magnitudes, while deltaVolume can be positive or negative indicating net buy or sell dominance.
If Use Custom Lower Timeframe is disabled, the indicator automatically chooses an appropriate lower timeframe based on the chart’s resolution. This adaptive logic uses 1-second intervals for charts in seconds, 1-minute for intraday minutes, 5-minute for daily charts, and 60-minute for anything higher, ensuring that up/down volume can be computed across various chart periods. If even finer resolution is needed or the user prefers a specific timeframe (e.g., 15S), enabling the custom option allows that override.
Coverage:
Because not all historical bars will have lower timeframe data available (especially if looking far back or on certain assets/timeframes), the script tracks how many bars actually received a valid up/down volume calculation. Each bar with non-na deltaVolume is counted toward a coverage total . This coverage count is displayed in the table (as “Coverage: X Bars”) to inform the user how many bars in the dataset had full volume breakdown data. It also serves a technical purpose: certain moving averages or calculations are “gated” to only output values when enough data points exist. For example, a 20-bar average of buy volume will not be shown until at least 20 bars with volume data are present; until then it returns NA to avoid misleading results. This gating mechanism is implemented via helper functions that check coverage before computing moving averages or sums. In practice, if you apply the indicator to a fresh chart or after changing the lower timeframe setting, you may see “NA” placeholders for some values until sufficient bars accumulate.
Volume Averages and Recent Change Indicators
For both buy and sell volume, the script computes short-term and medium-term averages to contextualize the current bar’s activity. Specifically, it calculates a 3-bar simple moving average and a 20-bar simple moving average of upVolume and downVolume (these lengths are fixed and chosen to represent a fast vs. slow window). These averages are shown in the table to compare against the current volume:
• The “Buy Current Amount” is the current bar’s buy volume, shown in an engineered format (e.g., 1.25K for 1,250) for readability. Directly below it (in the same cell via a newline) is “Avg : (3 | 20)”, which lists the 3-bar average buy volume and 20-bar average buy volume. Each average value is followed by an arrow marker:
an upward arrow 🔼 means the current buy volume is higher than that average, whereas a downward arrow 🔻 means the current buy volume is lower than that average. These markers give a quick visual cue – for instance, a 🔼 next to the (3) average indicates a volume spike in the very short term (current bar’s buy volume exceeds the recent 3-bar norm). If not enough data exists to compute an average, “NA” is displayed with the window in parentheses (e.g., “NA (20)” if fewer than 20 bars of coverage). The same format is used for Sell volume, where “Sell Current Amount” is the current bar’s sell volume with its own 3-bar and 20-bar averages and markers.
In addition to the short/medium term averages, the script also computes a “global” average buy volume and sell volume over the full Global Volume Period (using a slightly different approach). It first finds the proportion of buy vs sell over that window (summing all upVolume and downVolume over L = Global Volume Period bars) and then multiplies that ratio by the average total volume on the chart timeframe. This yields an implied average buy volume and sell volume for the global window (taking into account that the chart’s own volume may differ from summed LTF volume due to how the LTF data is sampled). These global averages are used internally (for example, in the OB/OS volume filter logic) but are not explicitly printed in the table. Instead, the table provides a more direct insight: the Positive Δ Sum and Negative Δ Sum (explained later) show accumulated buying vs selling pressure over the lookback period.
Price and Volume Trend Convergence/Divergence
Volume Scope Pro analyzes the short-term and medium-term trends of price and volume to identify convergence or divergence between price movement and buy/sell activity. This is done by calculating the angle of linear regression (slope in degrees) for price and for volume over the same two windows (3 bars and 20 bars). In essence, it fits a line through the last 3 closes and measures its angle, and similarly fits lines through the last 3 buy-volume values, last 3 sell-volume values, and repeats for 20 bars. The angles for price vs. volume are then compared:
• For the buy side, the indicator computes the price angle (θ) over 3 bars and 20 bars, and the buy-volume angle over 3 and 20 bars. These are displayed in the table under a “Buy Volume Trend” row. For example, it might show: “Price θ: 12.5° (3) | 5.0° (20)” on one line and “BuyVol θ: 8.0° (3) | 2.0° (20)” on the next. Each angle is given in degrees (θ symbol) with one decimal precision. A positive angle means an uptrend (price or volume increasing), and a negative angle means a downtrend over that window.
• After listing the angles, a convergence/divergence label is shown for each window: either Convergent or Divergent for the 3-bar window and similarly for the 20-bar window. This indicates whether price and buy volume are moving in the same direction (convergent) or opposite directions (divergent). For instance, if price’s 3-bar trend is up (positive slope) but buy-volume’s 3-bar trend is down (negative slope), that would be Divergent (3), signaling a short-term anomaly (price rising on falling buy volume). Conversely, if both price and buy volume are rising together over 20 bars, that shows Convergent (20), indicating buy volume is supporting the uptrend. These convergence/divergence labels help identify potential early warning signs: divergence may precede a reversal or indicate that an observed price move lacks volume support.
The same analysis is done for the sell side. The table’s “Sell Volume Trend” row lists “Price θ: ... | ...” and “SellVol θ: ... | ...” for 3 and 20 bars , followed by labels showing whether price vs. sell volume trends are convergent or divergent over those periods. For example, if price is trending down (negative angle) while sell volume is also trending down, they are Convergent (both indicating selling pressure in line with price drop). If price is falling but sell volume trend is up, that’s Divergent – price decrease accompanied by increasing sell volume could indicate aggressive selling (potential capitulation or acceleration of downtrend). On the other hand, price falling with decreasing sell volume might suggest selling is drying up (potential for a bottom). These nuances can be gleaned from the convergence/divergence outputs.
All angle calculations use a normalized linear regression slope converted to degrees for easy interpretation. The use of a short (3) and longer (20) window provides a quick glance at immediate vs. recent trend alignment. In the table, the angles and convergence labels are organized in two lines for buy and two lines for sell to clearly separate the information.
Volume Delta and Cumulative Delta Sums
The Volume Delta (Δ) for the current bar is a key metric showing the net difference between buy and sell volume. In the table, it appears as a single-line entry like “Delta: 5.2K” (for example) in the volume delta row. The value is formatted with K/M/B suffix if large, and it is colored green if positive (indicating net buying pressure) or red if negative (net selling pressure), with a neutral color if essentially zero. This coloring provides instant visual feedback: a green Delta means buyers dominated that bar, whereas a red Delta means sellers dominated. The delta number itself helps gauge the magnitude of that dominance. For instance, “Delta: 1.5M” in green would signify a very large imbalance of buying volume on that bar. This row gives a per-bar order flow insight complementing the price action of the candle.
To assess the broader context, the indicator also computes cumulative delta sums over the Global Volume Period. It separately accumulates all positive delta values and all negative delta values within the lookback window (e.g., 100 bars). The results are shown in the table as two lines: Positive Δ Sum and Negative Δ Sum, each followed by a number. These represent the total volume imbalance accumulated in each direction over the window. For example, a Positive Δ Sum of 20K means that, summing all bars in the window where buy > sell volume, buyers were ahead by a total of 20,000 volume (volume units) in that period. Similarly, a Negative Δ Sum of 15K would mean sellers were ahead by 15,000 volume in other bars. These sums give a sense of who is in control over the recent horizon: if Positive Δ Sum greatly exceeds Negative Δ Sum, the market has seen net accumulation (buying) in the lookback; if the reverse, net distribution (selling). The values are shown in a neutral text color (since they are not inherently “good” or “bad”) and are formatted with K/M suffixes as needed. They can help confirm trends or identify subtle shifts – for instance, if price is flat but Positive Δ Sum is growing rapidly, it might indicate stealth accumulation even without price movement.
Support/Resistance Zone Detection from Volume Extremes
Volume Scope Pro identifies key support and resistance areas by analyzing how volume behaved in recent price movements. Zones are derived from points where buying or selling activity became unusually strong or unusually weak—areas that often act as reaction levels in future price action.
A high-activity region is highlighted as a Resistance Zone, showing where strong participation previously slowed upward movement.
A low-activity region forms a Support Zone, indicating price levels where the market tended to stabilize or absorb pressure.
These zones are displayed as horizontal regions projected forward on the chart, with customizable colors and styling. Their upper and lower boundaries are shown in the on-chart table, where the indicator also notes whether each zone currently acts as support or resistance based on price position.
🟥 Resistance Zone based on
Buy/Sell Amount: 1.2345 ~ 1.2500
This indicates a resistance zone between roughly 1.2345 and 1.2500 (the bottom and top of that zone). “Buy/Sell Amount” here refers to the fact that this zone was computed from extreme buy/sell volume events, and the values are the zone’s price range. Likewise, a support zone line would be prefixed with 🟩 and show its range. These zones give a unique volume-based perspective on support and resistance, complementing traditional price-based levels.
Pivot-Based Trend Lines
The indicator draws adaptive trendlines by tracking recent swing highs and swing lows. Whenever the market forms meaningful pivots, the tool connects these points to outline the active upward and downward trend structure. A line drawn through recent highs generally acts as a dynamic resistance guide, while a line drawn through lows often behaves as a rising support boundary.
As market structure evolves, the trendlines update automatically, keeping the analysis aligned with the most recent swings. The color, thickness, and style of these lines are fully customizable. At any moment, you may see one line tracking the upper structure and one line tracking the lower structure, helping identify potential breakout areas or trend-channel behavior without manual drawing.
Overbought/Oversold Voting and Volume Signals
Volume Scope Pro includes an Overbought/Oversold engine that evaluates market exhaustion by combining technical momentum signals with real volume behavior. Instead of relying on a single indicator, the system draws from a broad set of classical oscillators, creating a multi-layer confirmation approach.
The tool aggregates signals from a group of well-known indicators and identifies when several of them simultaneously reach extreme levels. When enough of these indicators align, the condition is considered overbought or oversold. To refine these readings, an optional volume filter checks whether buying or selling pressure is unusually strong at the same time.
• Overbought (OB) is highlighted only when technical exhaustion coincides with elevated sell volume.
• Oversold (OS) appears when oversold readings align with strong buy volume.
When confirmed, the indicator places clear visual markers on the chart:
• OB – potential topping conditions supported by heavy selling.
• OS – potential bottoming conditions supported by strong buying.
• Distribution (↑P ↑S) – price rising while selling pressure increases.
• Absorption (↓P ↑B) – price falling while buyers absorb the move.
• Combined signals (OB+DIST or OS+ABS) highlight the strongest forms of exhaustion.
These markings help traders quickly recognize areas where momentum is fading and volume behavior becomes important. While they do not predict exact turning points, they often appear during phases where the market prepares for a shift, consolidation, or slowing trend.
Usage Notes and Interpretation
Volume Scope Pro provides a detailed view into the internal dynamics of market volume, which can greatly aid analysis when used appropriately. Here are some important considerations and best practices:
• Data Availability (Coverage): The accuracy and utility of this indicator depend on the availability of lower timeframe data for the instrument. On very high timeframe charts (weekly/monthly) or illiquid symbols, the automatic lower timeframe (like 1 minute or 5 minutes) might not retrieve full historical intrabar data, resulting in limited coverage. This is indicated in the “Coverage: X Bars” readout. If coverage is low, many of the volume-based values (especially 20-bar averages or global sums) may show “NA” or be unrepresentative until more data accumulates. It’s often best to use this indicator on active symbols and reasonable timeframes (e.g., 1h, 4h, 1D with a few months of data or lower) to ensure plenty of sub-bar data is available. If needed, you can reduce the Global Volume Period to focus on a smaller window that has full coverage, or experiment with a different Lower Timeframe that might have more data available (for example, using 1min instead of 15s on very long histories).
• Interpreting Volume Delta and Trends: A key value to watch is the Delta (Δ) and how it changes. For instance, if price is making new highs but Δ is decreasing or negative, it indicates bearish divergence – fewer buyers are supporting the move, or sellers might be increasingly active (distribution). Conversely, price making new lows while Δ becomes less negative or turns positive is a bullish divergence, implying sellers are exhausting and buyers are stepping in (absorption). The convergence/divergence rows quantitatively highlight these situations. Use them as alerts to investigate further rather than automatic trade signals. For example, a divergent 20-bar trend (price up, buy volume down) doesn’t mean price will immediately reverse, but it does warrant caution as the rally may be on weak footing.
• Support/Resistance Zones: The volume-derived S/R zones offer levels that might not be obvious from price alone. They often pinpoint areas where the tug-of-war between buyers and sellers was most extreme (resistance zone) or where the market had a lull in volume (support zone). Treat these zones as you would conventional support/resistance: price may react when revisiting them. A common use is to watch how price behaves upon approaching a highlighted zone – for instance, if price rallies into a red resistance zone and you see volume delta start to flip negative, it could strengthen the case that the zone is indeed acting as resistance due to renewed selling. The zones update once a new volume extreme enters or exits the lookback window, so they are relatively static during most recent price action, shifting only when a significantly larger volume spike happens or the oldest bar in the window moves out. They are also non-repainting for completed bars (the algorithm excludes the current bar for zone calculation to avoid repaint issues). Keep in mind these zones are horizontal areas; they do not guarantee a reversal, but they mark where supply or demand was notably strong in the past, which is useful context.
• Trend Lines and Pivots: The automatic trend lines drawn from pivot highs and lows can help visualize short-term price channels or triangles. They update in real-time as new pivots form. Use them as guidance for potential breakout or breakdown levels – e.g., if price breaks above a descending high line, that could indicate a bullish breakout from the recent down trend. The pivot detection sensitivity (Pivot Left/Right) can be tuned: higher values will only draw lines across more significant swings, whereas lower values will catch minor swings too. Adjust according to the volatility of the asset (more volatile assets might need larger pivot settings to filter noise). The trend lines are an auxiliary feature in this volume tool, meant to save time drawing those lines manually for recent swings. They work best when recent pivots are clear; in choppy conditions with many equal highs/lows, you might see the lines adjust frequently.
• OB/OS Voting Signals: The overbought/oversold markers (OB, OS, distribution, absorption) are perhaps the most actionable signals from this script, but they should not be used in isolation. They effectively combine momentum and volume analysis. A prudent approach is to confirm these signals with price action or other analysis:
• An “OB” (Overbought) marker suggests a probable short opportunity or at least to be cautious with longs. When you see OB, check if it aligns with other factors: Is price at a known resistance or a volume zone? Is there a bearish candlestick pattern? Multiple OB signals in a cluster (with or without “DIST”) could indicate a topping process – you might wait for price to start rolling over before acting.
• An “OS” (Oversold) marker points to a potential long opportunity or caution with shorts. Look for confluence such as the price being at a support zone, a bullish divergence in delta, or a reversal candle. Sometimes one OS by itself might just lead to a small bounce in an ongoing downtrend, but a series of OS/ABS signals could mark a accumulation phase.
• Distribution (↑P↑S) and Absorption (↓P↑B) markers can appear even without full OB/OS votes. These warn of stealthy behavior: e.g., Distribution triangles showing up during a steady uptrend might precede larger profit-taking drops. Absorption triangles in a downtrend might precede a relief rally. They are early warnings – pay attention if they start to cluster or coincide with known S/R levels.
• The combined labels OB+DIST and OS+ABS are stronger alerts since they mean both the indicators and volume are screaming extreme. These are relatively rarer; when they appear, the likelihood of at least a short-term reversal is higher. Still, disciplined risk management is essential as markets can remain overbought/oversold longer than expected.
• No Guarantees & Context: It’s important to emphasize that none of these outputs guarantee a price will move in a certain direction. They highlight conditions that historically often precede moves. Volume Scope Pro should be used as an informational tool to augment your analysis. For example, you might use it to confirm a breakout (volume delta turning strongly positive on a price break) or to spot divergence (price making a new high but Δ Sum not increasing). Always consider the broader context: trend direction, higher timeframe signals, fundamental news, etc. A bullish signal in a strong downtrend may only yield a minor correction, and a bearish signal in a roaring uptrend might just be a pause.
• Avoiding Over-Optimization: The indicator comes with many inputs. It might be tempting to tweak them frequently, but it’s recommended to start with defaults and adjust only if you understand the effect. For instance, if you increase Minimum Vote Count for OB/OS, you’ll get fewer but more conservative signals – you might miss early warnings. Changing Volume Spike Ratios alters how sensitive the volume filter is – lower ratios give more signals (even on modest volume rises) but risk false alarms. Use these settings to tailor the indicator to the asset or timeframe (e.g., a very high-volume asset might justify a higher spike ratio). The defaults have been chosen to suit a wide range of scenarios reasonably well.
• Performance and Chart Load: Volume Scope Pro does heavy processing by requesting a lower timeframe and calculating many values. On some platforms, loading this indicator might be slightly slower or consume more memory. It’s invite-only and not open-source, which means the calculations happen behind the scenes. If you experience any slowness, you can try using a less granular lower timeframe (e.g., 1min instead of 15s) or reduce the Global Volume Period to lighten the load. Generally it runs efficiently, but be mindful if stacking it with many other complex indicators.
In summary, Volume Scope Pro provides a set of volume-centric insights: from basic buy/sell volume split and delta, to trend alignment, to volume-profile S/R levels, to multi-indicator OB/OS warnings with volume validation. It adheres strictly to providing factual, data-driven information with no predictive guarantees. Traders can utilize this tool to observe where large buyers or sellers might be operating (“smart money”), detect when volume behavior contradicts price (a sign of potential reversals), and identify hidden support and resistance zones. All these pieces of information, when combined with sound strategy and risk management, can improve decision-making. Always remember to use this indicator as one part of a comprehensive analysis.

Scalping Dashboard - Volume Candles + Liquidity ZonesScalping Dashboard - Volume Candles + Liquidity Zones
📊 Overview
A comprehensive scalping indicator designed for high-frequency traders on 1-5 minute timeframes. This all-in-one dashboard combines volume analysis, order flow metrics, technical indicators, and institutional liquidity zones to identify high-probability scalping opportunities.
🎯 Key Features
✅ Multi-Timeframe Analysis
Fast MACD (5/13/5) for momentum
Quick EMAs (9/20/50) for trend direction
Rapid Stochastic (5/3/3) for oversold/overbought conditions
Fast RSI (7) for extreme readings
✅ Advanced Order Flow Metrics
CVD (Cumulative Volume Delta): Tracks buy vs sell pressure over time
Delta Momentum: Measures acceleration in buying/selling
Buy/Sell Pressure Ratio: Real-time balance of market forces
Order Flow Imbalance: Detects aggressive buying or selling
Tape Speed: Measures how fast volume is hitting the market
✅ Institutional Liquidity Zones
Buy-Side Liquidity: Areas above price where short stop losses cluster
Sell-Side Liquidity: Areas below price where long stop losses cluster
Liquidity Sweeps: Detects "stop hunts" by institutions before reversals
✅ Volume-Based Candle Coloring
Visual representation of volume intensity
Extreme, High, Normal, and Low volume categories
Fully customizable color schemes
✅ Dynamic Support/Resistance
Volume-weighted price levels
Automatically updates every 3 bars
Shows distance to key levels
📈 Dashboard Indicators Explained
The bottom-left dashboard displays 14 real-time metrics:
▸ MACD (●)
Green = Bullish momentum
Red = Bearish momentum
Gray = Neutral
▸ Supp (Price)
Support level
Green highlight = at support (good for long entry)
▸ Res (Price)
Resistance level
Orange highlight = at resistance (good for short entry)
▸ EMA (●)
Green = Price above EMAs (bullish)
Red = Price below EMAs (bearish)
▸ Stoch (●)
Green = Oversold (<20)
Red = Overbought (>80)
Gray = Neutral
▸ RSI (●)
Green = Oversold (<30)
Red = Overbought (>70)
Gray = Neutral
▸ CVD (●)
Green = Cumulative buying pressure
Red = Cumulative selling pressure
▸ ΔCVD (●)
Green = Increasing buy pressure
Red = Increasing sell pressure
▸ Imbal (●)
Green = Buy imbalance (>2:1 ratio)
Red = Sell imbalance
▸ Vol (●)
Green/Yellow background = Volume surge (>2x average)
▸ Tape (●)
Green/Yellow background = Fast tape (>1.5x speed)
▸ Liq (↑↓●)
↑ = Bullish sweep or near sell-side liquidity
↓ = Bearish sweep or near buy-side liquidity
● = Neutral
▸ Score (#L or #S)
Quality score (0-8) for Long or Short setups
Higher numbers = Better quality trade
▸ SCALP (LONG/SHORT/WAIT)
Primary signal
Bright color = High quality (score ≥5)
Dim color = Decent quality (score =4)
Gray = Wait for better setup
🎨 Candle Color System
Volume-Based Colors
Bright Green/Red: Extreme volume (>2.5x average) - Major moves
Medium Green/Red: High volume (>1.5x average) - Strong activity
Dull Green/Red: Normal volume - Standard market activity
Gray: Low volume (<0.5x average) - Avoid trading
Signal-Based Colors
Lime: Strong Long signal (score ≥5)
Green: Decent Long signal (score =4)
Orange: Strong Short signal (score ≥5)
Red: Decent Short signal (score =4)
Candle Color Modes (adjustable in settings):
Volume Only: Pure volume intensity
Volume + Signals: Signals override volume when present (default)
Signals Only: Only shows entry signals
🔵 Chart Indicators
Support & Resistance Lines
Green Line: Volume-weighted support level
Red Line: Volume-weighted resistance level
Lines update dynamically based on 100-bar volume profile
Liquidity Zones
Cyan Circles/Dashed Lines: Buy-side liquidity (above price)
Where short stop losses cluster
Potential targets for bullish moves
Institutions may push price here before reversing down
Magenta Circles/Dashed Lines: Sell-side liquidity (below price)
Where long stop losses cluster
Potential targets for bearish moves
Institutions may push price here before reversing up
Entry Markers
Large Green Triangle (▲): High quality long entry (score ≥5)
Small Green Triangle (▲): Decent long entry (score =4)
Large Orange Triangle (▼): High quality short entry (score ≥5)
Small Red Triangle (▼): Decent short entry (score =4)
Liquidity Sweep Markers
Cyan X-Cross (below bar): Bullish liquidity sweep - "LIQ↑"
Price swept sell-side liquidity and reversed up
Strong buy signal
Magenta X-Cross (above bar): Bearish liquidity sweep - "LIQ↓"
Price swept buy-side liquidity and reversed down
Strong sell signal
🎯 How to Use This Indicator
For Long Scalps (Buy):
Wait for Dashboard Signal: SCALP = "LONG" with score ≥5
Confirm Multiple Green Dots: Look for EMA, CVD, ΔCVD, Imbal all green
Check Volume: Vol or Tape should show yellow background (surge)
Look for Confluence:
Price at or near Support level (green highlight)
Price near Sell-Side Liquidity (magenta line below)
RSI oversold (green dot)
Large green triangle appears on chart
Best Entry: On a bullish liquidity sweep (cyan X-cross)
For Short Scalps (Sell):
Wait for Dashboard Signal: SCALP = "SHORT" with score ≥5
Confirm Multiple Red Dots: Look for EMA, CVD, ΔCVD, Imbal all red
Check Volume: Vol or Tape should show yellow background (surge)
Look for Confluence:
Price at or near Resistance level (orange highlight)
Price near Buy-Side Liquidity (cyan line above)
RSI overbought (red dot)
Large orange triangle appears on chart
Best Entry: On a bearish liquidity sweep (magenta X-cross)
Three Types of Scalping Setups:
1. Quick Scalp (Fastest - 1-5 minute holds)
MACD or Stochastic crossover + Volume surge
At Support/Resistance level
Score ≥4
2. Momentum Scalp (Ride the wave - 5-15 minute holds)
Strong EMA alignment + CVD slope positive
Order flow imbalance + Fast tape
Volume surge with price structure
Score ≥5
3. Reversal Scalp (Fade extremes - 3-10 minute holds)
Stochastic + RSI extreme readings
At Support/Resistance OR liquidity sweep
CVD momentum reversal
Score ≥6
⚙️ Recommended Settings
Timeframes
Primary: 1-minute, 2-minute, 5-minute
Confirmation: Use 15-minute chart for overall trend direction
Asset Types
Forex pairs (high liquidity)
Crypto (BTC, ETH with high volume)
Futures (ES, NQ)
Major stocks during market hours
Risk Management
Target: 1-3 times your stop loss
Stop Loss: Below nearest liquidity zone for longs, above for shorts
Position Size: Never risk more than 1% per trade
Score ≥5: Take full position size
Score =4: Take half position size or skip
🔧 Customization Options
Input Groups
MACD Settings
Fast Length: 5 (scalping optimized)
Slow Length: 13
Signal Length: 5
EMA Settings
EMA 9, 20, 50 (fast scalping EMAs)
Stochastic Settings
%K Length: 5
%D Smoothing: 3
Smooth: 3
CVD Settings
MA Length: 10 (for CVD smoothing)
RSI Settings
Length: 7 (fast RSI)
Overbought: 70
Oversold: 30
Volume Settings
MA Length: 10
Extreme Multiplier: 2.5x
High Multiplier: 1.5x
Low Multiplier: 0.5x
Liquidity Zone Settings
Lookback Periods: 20
Swing Strength: 3
Show Liquidity Zones: On/Off
Show Liquidity Sweeps: On/Off
Support/Resistance Settings
Volume Lookback: 100 bars (~2 hours on 1-min chart)
Order Flow Settings
Imbalance Threshold: 2.0 (2:1 ratio)
Color Customization
All volume colors customizable
All signal colors customizable
All liquidity colors customizable
📊 Volume Legend (Top Right)
The small table in the top-right corner shows the volume intensity key:
Extreme: >2.5x average volume
High: >1.5x average volume
Normal: 0.5x to 1.5x average volume
Low: <0.5x average volume
🔔 Built-in Alerts
Set up these alerts to never miss a trade:
High Quality Long Scalp: Triggers when entry_long and score ≥5
High Quality Short Scalp: Triggers when entry_short and score ≥5
Bullish Liquidity Sweep: Triggers when sell-side liquidity is swept
Bearish Liquidity Sweep: Triggers when buy-side liquidity is swept
To set up: Right-click chart → Add Alert → Select condition → Create
💡 Pro Tips
Understanding Liquidity Zones
Buy-Side Liquidity = Where shorts have their stops = Price tends to wick up here
Sell-Side Liquidity = Where longs have their stops = Price tends to wick down here
Liquidity Sweep = Institution triggers stops, absorbs liquidity, then reverses
Best trades = Enter AFTER the sweep when price reverses back
Reading the Dashboard
All Green Dots + Yellow Volume = Strong Long Setup
All Red Dots + Yellow Volume = Strong Short Setup
Mixed Colors = Choppy/Neutral = Wait
Score 6+ = Highest probability trades
Score 3 or less = Avoid
Confluence is Key
Never trade on a single indicator. Wait for:
Dashboard score ≥5
Volume surge (yellow background)
At support/resistance OR liquidity zone
CVD and momentum aligned
Price structure confirmation (triangle marker)
Avoid These Situations
❌ Low volume periods (gray candles)
❌ Dashboard shows "WAIT"
❌ Score below 4
❌ No volume surge during entry
❌ Trading against higher timeframe trend
Best Trading Sessions
Forex: London open (3-5 AM EST), NY open (8-10 AM EST)
Crypto: Works 24/7, best during high volume periods
Stocks: First hour (9:30-10:30 AM EST), last hour (3-4 PM EST)
Futures: US session open (9:30 AM EST)
🎓 Understanding the Scoring System
The indicator calculates a quality score (0-8) for both long and short setups:
+1 point for each:
EMA bias aligned (price above/below EMA structure)
CVD momentum bias aligned (buying/selling pressure)
Buy/Sell pressure ratio aligned (>1.5x or <0.67x)
Volume strength (surge detected)
Order flow imbalance (>2:1 ratio)
Tape speed (>1.3x average)
Price structure (higher highs or lower lows)
Liquidity bias (sweep detected)
Score Interpretation:
7-8: Extremely high probability (rare, take immediately)
6: Very high probability (excellent trade)
5: High probability (good trade)
4: Decent probability (acceptable with tight stop)
3 or less: Low probability (wait for better setup)
📋 Quick Reference Card
Entry Checklist
Dashboard shows LONG or SHORT
Score is ≥5
Multiple indicators aligned (green or red dots)
Volume surge present (yellow background)
At support/resistance or liquidity zone
Triangle marker appeared on chart
Risk:Reward ratio is at least 1:2
Exit Strategy
Take Profit: At opposite liquidity zone or resistance/support
Stop Loss: Below sell-side liquidity (longs) or above buy-side liquidity (shorts)
Trail Stop: Move to breakeven after 1:1 risk:reward achieved
⚠️ Important Notes
This is NOT a holy grail: No indicator is 100% accurate. Always use proper risk management.
Backtest first: Paper trade or backtest on your specific instrument before using real money.
Market conditions matter: This indicator works best in trending or volatile markets, not in tight consolidation.
Combine with price action: Use the indicator as confluence with your own price action reading.
Adjust for your instrument: Different assets may require tweaking the sensitivity settings.
Lower timeframes = More noise: 1-minute charts have more false signals than 5-minute charts.
🔄 Version History
v1.0 - Initial release
Multi-indicator dashboard
Volume-based candle coloring
Support/Resistance detection
Entry signal generation
v2.0 - Current version
Added liquidity zone detection
Added liquidity sweep identification
Enhanced scoring system (now 0-8)
Added liquidity bias to entries
New alerts for liquidity sweeps
Improved dashboard with Liq indicator
📞 Support & Feedback
If you find this indicator helpful, please:
⭐ Give it a boost
💬 Share your results in the comments
🐛 Report any bugs or issues
💡 Suggest improvements
Disclaimer: This indicator is for educational purposes only. Trading involves significant risk. Past performance does not guarantee future results. Always trade responsibly and never risk more than you can afford to lose.
🏆 Credits
Created for serious scalpers who want institutional-level insights on retail charts. Combines order flow analysis, volume profiling, and liquidity mapping into one comprehensive tool.
Happy Scalping! 🚀📈
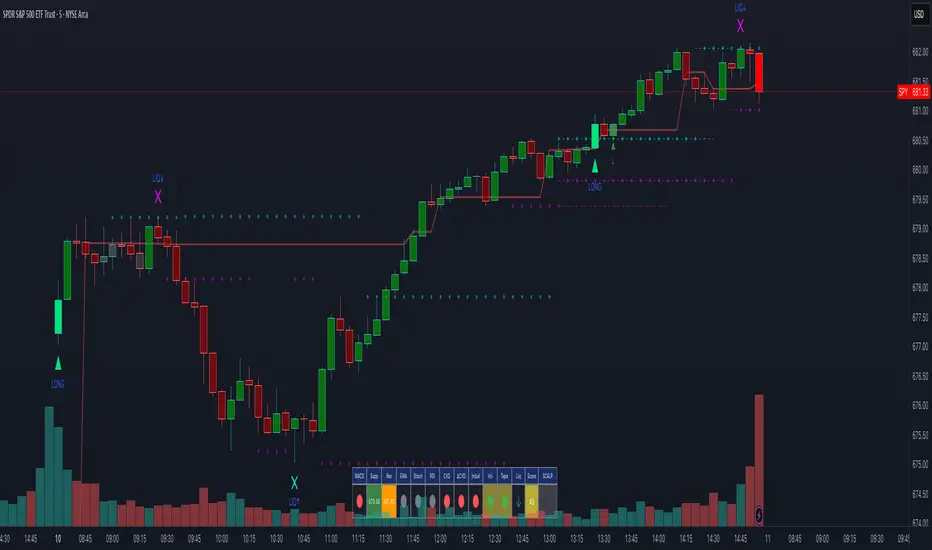
Monthly Color Marker V4
## 📊 Monthly Color Marker - Historical Month Highlighting
### Overview
A unique indicator that allows rapid identification of all monthly candles from a specific month across multiple years. The indicator marks candles with different colors based on their direction (bullish/bearish), enabling quick analysis of seasonal patterns and cyclical behavior of stocks or assets.
### 🎯 Purpose
- **Identify Seasonal Patterns (Seasonality)** - Discover recurring trends in specific months
- **Quick Historical Analysis** - Visual representation of monthly performance over the years
- **Direction Recognition** - Instant understanding of whether a month tends to be bullish or bearish
- **Seasonal Trading Planning** - Build strategies based on cyclical patterns
### ⚙️ Adjustable Parameters
1. **Month to Mark (1-12)**
- Select the desired month for analysis
- 1 = January, 2 = February... 12 = December
- Default: 11 (November)
2. **Years Back (1-50)**
- Determines how many years back to scan
- Recommended: 10-25 years for statistically reliable data
- Default: 25 years
3. **Bullish Candle Color**
- Color for marking bullish candles (close > open)
- Default: Green
- Customizable to your personal color scheme
4. **Bearish Candle Color**
- Color for marking bearish candles (close < open)
- Default: Red
- Customizable to your personal color scheme
5. **Show Current Year**
- Whether to include the current month in the marking
- Useful when the month hasn't finished yet
- Default: Yes
### 📈 How to Use the Indicator
#### Step 1: Adding to Chart
1. Switch to **Monthly timeframe** - Required!
2. Add the indicator to your chart
3. Select the month you want to analyze
#### Step 2: Initial Analysis
- **Count green vs red candles** - What's the ratio?
- **Look for patterns** - Are there years where the month always rises/falls?
- **Identify outliers** - Years where behavior was different
#### Step 3: Making Decisions
- **Mostly green** → Statistically, the month tends to rise
- **Mostly red** → Statistically, the month tends to fall
- **Mixed** → No clear seasonal pattern
### 💡 Usage Examples
**Example 1: "Santa Claus Rally"**
- Select month 12 (December)
- Check if there are mostly green candles
- If yes, this confirms the well-known year-end rally effect
**Example 2: "September Effect"**
- Select month 9 (September)
- Historically, September is considered a weak month
- Do the data support this for this stock?
**Example 3: Quarterly Earnings**
- Identify which month earnings are released
- Check the historical response
- Plan entry/exit accordingly
### 🔍 Combining with Other Indicators
This indicator works excellently with:
- **Historical Monthly Levels** (the first indicator) - Identify nearby price levels
- **Volume Profile** - Check volume during those months
- **RSI/MACD** - Identify momentum strength in specific months
### ⚠️ Important Notes
1. **Must use Monthly timeframe!** The indicator won't work correctly on other timeframes
2. **Statistical Sample** - More years = more reliable analysis
3. **Not a Guarantee** - Past performance doesn't guarantee future results, use additional analysis
4. **Adjust Colors** - If hard to see, change colors in settings
### 🎨 Tips for Optimal Experience
- **Zoom Out** - See more years at a glance
- **Clean Chart** - Remove unnecessary indicators for clear analysis
- **Compare Stocks** - Check multiple stocks for the same month
- **Document Findings** - Take screenshots and save insights for future reference
### 📊 Recommended Statistics
After identifying an interesting month:
- Calculate success rate (green / total candles)
- Check average volatility
- Identify outlier years and investigate what happened
- Plan entry/exit strategy
### 🚀 Who Is This Indicator For?
✅ **Swing Traders** - Plan medium-term trades
✅ **Seasonal Investors** - Exploit cyclical patterns
✅ **Technical Analysts** - Understand historical behavior
✅ **Portfolio Managers** - Time entries and exits
---
### 📝 Summary
The Monthly Color Marker indicator is a powerful and easy-to-use tool for identifying seasonal patterns. The combination of clear visualization with flexible parameters makes it an essential tool for any trader seeking a statistical edge in the market.
**Recommendation:** Start with 25 years back, analyze 2-3 key months, and build a data-driven strategy.
---
**Version:** 4.0
**Compatibility:** Pine Script v5
**Timeframe:** Monthly only
**Author:** 954
## 📊 Monthly Color Marker - סימון חודשים היסטוריים
### תיאור כללי
אינדיקטור ייחודי המאפשר לזהות במהירות את כל הנרות החודשיים מחודש ספציפי לאורך השנים. האינדיקטור מסמן את הנרות בצבעים שונים בהתאם לכיוון התנועה (עלייה/ירידה), ומאפשר ניתוח מהיר של דפוסים עונתיים והתנהגות מחזורית של המניה או הנכס.
### 🎯 מטרת האינדיקטור
- **זיהוי דפוסים עונתיים (Seasonality)** - מציאת מגמות חוזרות בחודשים מסוימים
- **ניתוח היסטורי מהיר** - ראייה ויזואלית של ביצועי החודש לאורך השנים
- **זיהוי כיווניות** - הבנה מיידית האם החודש נוטה להיות שורי או דובי
- **תכנון מסחר עונתי** - בניית אסטרטגיות מבוססות מחזוריות
### ⚙️ פרמטרים מתכווננים
1. **חודש לסימון (1-12)**
- בחירת החודש הרצוי לניתוח
- 1 = ינואר, 2 = פברואר... 12 = דצמבר
- ברירת מחדל: 11 (נובמבר)
2. **שנים אחורה (1-50)**
- קובע כמה שנים אחורה לסרוק
- מומלץ: 10-25 שנים לקבלת תמונה סטטיסטית מהימנה
- ברירת מחדל: 25 שנים
3. **צבע נר עולה**
- צבע לסימון נרות שורים (close > open)
- ברירת מחדל: ירוק
- ניתן להתאים לסכמת הצבעים האישית
4. **צבע נר יורד**
- צבע לסימון נרות דוביים (close < open)
- ברירת מחדל: אדום
- ניתן להתאים לסכמת הצבעים האישית
5. **צבע את השנה הנוכחית**
- האם לכלול את החודש הנוכחי בסימון
- שימושי כאשר החודש טרם הסתיים
- ברירת מחדל: כן
### 📈 איך להשתמש באינדיקטור
#### שלב 1: הוספה לגרף
1. עבור לטיימפריים **חודשי (Monthly)** - חובה!
2. הוסף את האינדיקטור לגרף
3. בחר את החודש שאתה רוצה לנתח
#### שלב 2: ניתוח ראשוני
- **ספור נרות ירוקים מול אדומים** - מה היחס?
- **חפש דפוסים** - האם יש שנים שבהן החודש תמיד עולה/יורד?
- **זהה חריגים** - שנים שבהן ההתנהגות הייתה שונה
#### שלב 3: קבלת החלטות
- **רוב ירוקים** → סטטיסטית החודש נוטה לעלות
- **רוב אדומים** → סטטיסטית החודש נוטה לרדת
- **מעורב** → אין דפוס עונתי ברור
### 💡 דוגמאות שימוש
**דוגמה 1: "Santa Claus Rally"**
- בחר חודש 12 (דצמבר)
- בדוק אם יש רוב נרות ירוקים
- אם כן, זה מאשר את האפקט הידוע של עליות בסוף השנה
**דוגמה 2: "September Effect"**
- בחר חודש 9 (ספטמבר)
- היסטורית, ספטמבר נחשב לחודש חלש
- האם הנתונים תומכים בכך במניה זו?
**דוגמה 3: דיווחים רבעוניים**
- זהה בחודש אילו נפרסמים דיווחים
- בדוק את התגובה ההיסטורית
- תכנן כניסה/יציאה בהתאם
### 🔍 שילוב עם אינדיקטורים אחרים
האינדיקטור עובד מצוין בשילוב עם:
- **Historical Monthly Levels** (האינדיקטור הראשון) - זיהוי רמות מחיר קרובות
- **Volume Profile** - בדיקת ווליום באותם חודשים
- **RSI/MACD** - זיהוי כוח המומנטום בחודשים ספציפיים
### ⚠️ הערות חשובות
1. **חובה להשתמש בטיימפריים חודשי!** האינדיקטור לא יעבוד נכון בטיימפריים אחרים
2. **מדגם סטטיסטי** - ככל שיש יותר שנים, הניתוח מהימן יותר
3. **לא ערובה** - עבר לא מבטיח עתיד, השתמש בניתוח נוסף
4. **התאם צבעים** - אם קשה לראות, שנה את הצבעים בהגדרות
### 🎨 טיפים לחוויית שימוש מיטבית
- **זום אאוט** - ראה יותר שנים במבט אחד
- **נקה גרף** - הסר אינדיקטורים מיותרים לניתוח ברור
- **השווה מניות** - בדוק מספר מניות לאותו חודש
- **תעד ממצאים** - צלם מסך ושמור תובנות לעתיד
### 📊 סטטיסטיקה מומלצת
לאחר שזיהית חודש מעניין:
- חשב אחוז הצלחה (ירוקים / כל הנרות)
- בדוק תנודתיות ממוצעת
- זהה שנים חריגות ובדוק מה קרה אז
- תכנן אסטרטגיית כניסה/יציאה
### 🚀 למי מתאים האינדיקטור?
✅ **סווינג טריידרים** - תכנון עסקאות לטווח בינוני
✅ **משקיעים עונתיים** - ניצול דפוסים מחזוריים
✅ **אנליסטים טכניים** - הבנת התנהגות היסטורית
✅ **מנהלי תיקים** - תזמון כניסות ויציאות
---
### 📝 סיכום
אינדיקטור Monthly Color Marker הוא כלי חזק וקל לשימוש לזיהוי דפוסים עונתיים. השילוב של ויזואליזציה ברורה עם פרמטרים גמישים הופך אותו לכלי חיוני לכל טריידר המחפש יתרון סטטיסטי בשוק.
**המלצה:** התחל עם 25 שנים אחורה, נתח 2-3 חודשים מרכזיים, ובנה אסטרטגיה מבוססת נתונים.
---
**גרסה:** 4.0
**תאימות:** Pine Script v5
**טיימפריים:** חודשי בלבד
**מחבר:** [954
---

Pivot Orderflow DeltaThis indicator analyzes order flow by calculating a continuous Cumulative Volume Profile Delta (CVPD). It plots this delta as a series of "delta candles" and identifies divergences and structural pivot levels.
Key Features:
Statistical Delta Engine: For each bar, the indicator builds a high-resolution volume profile on a lower 'Intra-Bar Timeframe'. It uses statistical models ('PDF' allocation) and advanced classifiers ('Dynamic' split) to determine the buy/sell pressure, which is then accumulated.
Cumulative Delta Candle Visualization: The indicator plots the continuous, accumulated delta as a series of candles, where for each bar:
Open: Is the cumulative delta value of the previous bar.
Close: Is the new total cumulative delta.
High/Low: Represent the peak/trough cumulative delta reached during that bar's formation.
Dynamic Pivot Baseline: The indicator plots a separate dynamic baseline ('Impulse Start') that adjusts when a new price pivot is confirmed.
When a price high forms, the baseline moves to the lower of its previous level or the peak delta (max of delta candle O/C) at the pivot.
When a price low forms, the baseline moves to the higher of its previous level or the trough delta (min of delta candle O/C) at the pivot.
Full Divergence Suite (Class A, B, C): A built-in divergence engine automatically detects and plots Regular (A), Hidden (B), and Exaggerated (C) divergences between price and the peak/trough of the delta candles (High/Low).
Detailed Pivot Confluence: The indicator plots distinct markers to differentiate between pivots occurring only on the price chart, only on the delta oscillator, or on both simultaneously.
Note on Confirmation (Lag): Divergence and pivot signals rely on a confirmation method. A pivot is only plotted after the Pivot Right Bars input has passed, which introduces an inherent lag.
Integrated Alerts: Includes 23 comprehensive alerts for:
The start and end of all 6 divergence types.
The detection of a new Impulse Start pivot.
Delta/volume agreement/disagreement.
Delta crossing the zero line.
The formation of price-only or delta-only pivots.
Caution: Real-Time Data Behavior (Intra-Bar Repainting) This indicator uses high-resolution intra-bar data. As a result, the values on the current, unclosed bar (the real-time bar) will update dynamically as new intra-bar data arrives. This behavior is normal and necessary for this type of analysis. Signals should only be considered final after the main chart bar has closed.
DISCLAIMER
For Informational/Educational Use Only: This indicator is provided for informational and educational purposes only. It does not constitute financial, investment, or trading advice, nor is it a recommendation to buy or sell any asset.
Use at Your Own Risk: All trading decisions you make based on the information or signals generated by this indicator are made solely at your own risk.
No Guarantee of Performance: Past performance is not an indicator of future results. The author makes no guarantee regarding the accuracy of the signals or future profitability.
No Liability: The author shall not be held liable for any financial losses or damages incurred directly or indirectly from the use of this indicator.
Signals Are Not Recommendations: The alerts and visual signals (e.g., crossovers) generated by this tool are not direct recommendations to buy or sell. They are technical observations for your own analysis and consideration.

ProScalper📊 ProScalper - Professional 1-Minute Scalping System
🎯 Overview
ProScalper is a sophisticated, multi-confluence scalping indicator designed specifically for 1-minute chart trading. Combining advanced technical analysis with intelligent signal filtering, it provides high-probability trade setups with clear entry, stop loss, and take profit levels.
✨ Key Features
🔺 Smart Signal Detection
Range Filter Technology: Fast-responding trend detection (25-period) optimized for 1-minute timeframe
Medium-sized triangles appear above/below candles for clear buy/sell signals
Only most recent signal shown - no chart clutter
Automatically deletes old signals when new ones appear
📋 Real-Time Signal Table
Top-center display shows complete trade breakdown
Grade system: A+, A, B+, B, C+ ratings for every setup
All confluence reasons listed with checkmarks
Score and R:R displayed for instant trade quality assessment
Color-coded: Green for LONG, Red for SHORT
📐 Multi-Confluence Analysis
ProScalper combines 10+ technical factors:
✅ EMA Trend: 4 EMAs (200, 48, 13, 8) for multi-timeframe alignment
✅ VWAP: Dynamic support/resistance
✅ Fibonacci Retracement: Golden ratio (61.8%), 50%, 38.2%, 78.6%
✅ Range Filter: Adaptive trend confirmation
✅ Pivot Points: Smart reversal detection
✅ Volume Analysis: Spike detection and volume profile
✅ Higher Timeframe: 5-minute trend confirmation
✅ HTF Support/Resistance: Key levels from higher timeframes
✅ Liquidity Sweeps: Smart money detection
✅ Opening Range Breakout: First 15-minute range
💰 Complete Trade Management
Entry Lines: Dashed green (LONG) or red (SHORT) showing exact entry
Stop Loss: Red dashed line with price label
Take Profit: Blue dashed line with price label and R:R
Partial Exits: 1R level marked with orange dashed line
All lines extend 10 bars for clean alignment with Fibonacci levels
📊 Dynamic Risk/Reward
Adaptive R:R calculation based on market volatility
Targets adjusted for pivot distances
Minimum 1.2:1 to maximum 3.5:1 for scalping
Position sizing based on account risk percentage
🎨 Professional Visualization
Clean chart layout - no clutter, only essential information
Custom EMA colors: Red (200), Aqua (48), Green (13), White (8)
Gold VWAP line for key support/resistance
Color-coded Fibonacci: Bright yellow (61.8%), white (50%), orange (38.2%), fuchsia (78.6%)
No shaded zones - pure price action focus
📈 Performance Tracking
Real-time statistics table (optional)
Win rate, total trades, P&L tracking
Average R:R and win/loss ratios
Setup-specific performance metrics
⚙️ Settings & Customization
Risk Management
Adjustable account risk per trade (default: 0.5%)
ATR-based stop loss multiplier (default: 0.8 for tight scalping)
Dynamic position sizing
Signal Sensitivity
Confluence Score Threshold: 40-100 (default: 55 for balanced signals)
Range Filter Period: 25 bars (fast signals for 1-min)
Range Filter Multiplier: 2.2 (tighter bands for more signals)
Visual Controls
Toggle signal table on/off
Show/hide Fibonacci levels
Control EMA visibility
Adjust table text size
Partial Exits
1R: 50% (default)
2R: 30% (default)
3R: 20% (default)
Fully customizable percentages
Trailing Stops
ATR-Based (best for scalping)
Pivot-Based
EMA-Based
Breakeven trigger at 0.8R
🎯 Best Use Cases
Ideal For:
✅ 1-minute scalping on liquid instruments
✅ Day traders looking for quick 2-8 minute trades
✅ High-frequency trading with 8-15 signals per session
✅ Trending markets where Range Filter excels
✅ Crypto, Forex, Futures - works on all liquid assets
Trading Style:
Timeframe: 1-minute (can work on 3-5 min with adjusted settings)
Hold Time: 3-8 minutes average
Target: 1.2-3R per trade
Frequency: 8-15 signals per day
Win Rate: 45-55% (with proper risk management)
📋 How to Use
Step 1: Wait for Signal
Watch for green triangle (BUY) or red triangle (SELL)
Signal table appears at top center automatically
Step 2: Review Confluence
Check grade (prefer A+, A, B+ for best quality)
Review all reasons listed in table
Confirm score is above your threshold (55+ recommended)
Note the R:R ratio
Step 3: Enter Trade
Enter at current market price
Set stop loss at red dashed line
Set take profit at blue dashed line
Mark 1R level (orange line) for partial exit
Step 4: Manage Trade
Exit 50% at 1R (orange line)
Move to breakeven after 0.8R
Trail remaining position using your chosen method
Exit fully at TP or opposite signal
🎨 Chart Setup Recommendations
Optimal Display:
Timeframe: 1-minute
Chart Type: Candles or Heikin Ashi
Background: Dark theme for best color visibility
Volume: Enable volume bars below chart
Complementary Indicators (optional):
Order flow/Delta for institutional confirmation
Market profile for key levels
Economic calendar for news avoidance
⚠️ Important Notes
Risk Disclaimer:
Not financial advice - for educational purposes only
Always use proper risk management (0.5-1% per trade max)
Past performance doesn't guarantee future results
Test on demo account before live trading
Best Practices:
✅ Trade during high liquidity hours (9:30-11 AM, 2-4 PM EST)
✅ Avoid news events and market open/close (first/last 2 minutes)
✅ Use tight stops (0.8-1.0 ATR) for 1-minute scalping
✅ Take partial profits quickly (1R = 50% off)
✅ Respect max daily loss limits (3% recommended)
✅ Focus on A and B grade setups for consistency
What Makes This Different:
🎯 Complete system - not just signals, but full trade management
📊 Multi-confluence - 10+ factors analyzed per trade
🎨 Professional visualization - clean, focused chart design
⚡ Optimized for 1-min - settings specifically tuned for fast scalping
📋 Transparent reasoning - see exactly why each trade was taken
🏆 Grade system - instantly know trade quality
🔧 Technical Details
Pine Script Version: 5
Overlay: Yes (plots on price chart)
Max Lines: 500
Max Labels: 100
Non-repainting: All signals confirmed on bar close
Alerts: Compatible with TradingView alerts
📞 Support & Updates
This indicator is actively maintained and optimized for 1-minute scalping. Settings can be adjusted for different timeframes and trading styles, but default configuration is specifically tuned for high-frequency 1-minute scalping.
🚀 Get Started
Add ProScalper to your 1-minute chart
Adjust settings to your risk tolerance
Wait for signals (green/red triangles)
Follow the signal table guidance
Manage trades using provided levels
Track performance with stats table
Happy Scalping! 📊⚡💰

VolumeAnlaysis### Volume Analysis (VA) Indicator
**Overview**
The Volume Analysis (VA) indicator is a dynamic overlay tool designed for traders seeking to identify high-volume breakouts, retests, and multi-timeframe volume-driven price cycles. By combining volume spikes with price action and support/resistance boxes, it highlights potential trend continuations, reversals, and cycle shifts. Ideal for intraday and swing trading on stocks, forex, or crypto, it uses a Fibonacci-inspired 1.618 multiplier to detect significant volume surges, then maps them to visual boxes and key levels for actionable insights.
This indicator draws from volume profile concepts but focuses on **breakout confirmation** and **cycle momentum**, helping you spot when "smart money" volume aligns with price extremes. It's particularly useful in volatile markets where volume precedes price moves.
**How It Works**
1. **Volume Break Detection**:
- Identifies a "Volume Break" when the current bar's volume exceeds 1.618x the highest volume from the prior 5 bars. This signals unusual activity, often preceding breakouts.
- A "Volume Retest" triggers exactly 3 bars after a break if volume has been falling steadily over those 3 bars—indicating a pullback for re-accumulation/distribution.
2. **Visual Annotations**:
- **Labels**: Green/red/yellow labels mark Volume Breaks and Retests, positioned above/below the bar based on candle direction for clarity.
- **Demand/Supply Boxes**:
- Blue semi-transparent boxes form around Retest bars, extending rightward to act as dynamic support/resistance.
- Green (bullish) or red (bearish) boxes draw from Volume Breaks, based on the original candle's open/close, highlighting potential zones for continuation.
- Limited to 5 boxes max to avoid chart clutter; older boxes fade as new ones form.
3. **Box Interaction Signals**:
- When price enters a box:
- **Reversal Hints**: Maroon (bearish rejection) or lime (bullish rejection) labels on closes against the trend with opening price momentum.
- **Breakout Arrows**: Up/down arrows on crossovers/crossunders of box tops/bottoms from Retest boxes.
- Scans all active boxes for interactions, prioritizing recent volume events.
4. **Multi-Timeframe Volume Cycles**:
- Aggregates the "Volume Break Max" level (a proxy for key price extremes tied to volume spikes) across timeframes: 1min, 5min, 10min, 30min, and 65min (using `request.security`).
- Computes **MaxVolBreak** (highest extreme) and **MinVolBreak** (lowest extreme) for trend-following levels.
- Tracks **Percent Volume Greater/Less Than Close**: Sums volumes from TFs where price is below/above these levels, creating a momentum ratio.
- **CrossClose**: Plots the prior close where this ratio crosses (gray line), signaling cycle shifts—bullish below MinVolBreak, bearish above MaxVolBreak.
- **Fills**: Red fill above CrossClose/MaxVolBreak (bearish cycle); green below CrossClose/MinVolBreak (bullish cycle).
5. **Plots**:
- Black lines for MaxVolBreak (⏫) and MinVolBreak (⏬).
- Gray 🔄 for CrossClose.
- Colors dynamically adjust (green/red) based on close relative to levels.
**Key Features**
- **Trend vs. Reversal Modes**: Toggle alerts for trend-following breaks (crosses of Max/MinVolBreak) or reversal signals (crosses of CrossClose).
- **Multi-TF Fusion**: Optionally include the chart's native timeframe in Max/Min calculations for finer tuning.
- **Box Management**: Auto-prunes to 5 boxes; focuses on retest/break alignments for "inside bar" logic.
- **Momentum Filters**: Uses rising/falling opens and crossovers for label precision, reducing noise.
- **Customizable**: Simple inputs for alert visibility and timeframe inclusion.
**Settings**
| Input | Default | Description |
|-------|---------|-------------|
| Show Volume Reversal Breaks | False | Enables alerts/labels for CrossClose crosses (cycle reversals). |
| Show Trend Following Breaks | True | Enables alerts for Max/MinVolBreak crosses (trend signals). |
| Use Current Time | False | Includes chart's native TF in multi-TF Max/Min calculations. |
**Alerts**
- **Reversal Alerts** (if enabled): "Volume Reverse Bullish/Bearish Break of " on close crosses of CrossClose.
- **Trend Alerts** (if enabled): "Trend Volume Bullish/Bearish Signal" on close crosses of Max/MinVolBreak; plus notes if prior low/high aligns with levels.
- All alerts include ticker and level value for easy scanning. Use `alert.freq_once_per_bar` to avoid spam.
**Trading Ideas**
- **Bullish Entry**: Green box formation + price holding MinVolBreak + upward arrow on retest box. Target next resistance.
- **Bearish Entry**: Red box + close above MaxVolBreak + red fill activation. Stop below recent low.
- **Cycle Trading**: Watch CrossClose crosses for regime shifts—fade extremes in overextended cycles.
- **Best Timeframes**: 5-30min for intraday; combine with daily for swings. Works best on liquid assets with reliable volume data.
**Limitations & Notes**
- Relies on accurate volume data (e.g., stocks/forex); less effective on low-volume or synthetic instruments.
- Boxes extend rightward but don't auto-delete—monitor for clutter on long histories (max_bars_back=500).
- Some logic (e.g., exact 3-bar retest) is rigid; backtest for your market.
- Open-source under MPL 2.0—fork and tweak as needed!
For questions or enhancements, drop a comment below. Happy trading! 🚀

Volume Exponential Moving Averages (EMA)
Description:
This script is a simple script that plots a desired exponential moving average of buy and sell volume as a line chart with a tunable smoothing factor. There is a highlight on the plot area of either green or red to denote if the EMA of buy volume or sell volume is of a higher value. This indicator uses basic math of exponential averages and calculates volume using the formulas: "buy volume" = the product of total volume and the "closing price" minus the "low price" divided by "high price" minus the "low price" for a specific candle. Conversely, "sell volume" = the product of "total volume" and the "high price" minus the "close price" divided by "high price" minus the "low price" for a specific candle.
Utility:
This indicator is an effective way to gauge the acceleration/ deceleration of buyers and sellers in the market and can be used in combination with market structure and important levels to understand if buyers or sellers are taking over at any given time.
How to use this indicator:
There are two settings for this indicator:
1. The Length of the EMA: The length of the EMA can be adjusted based on your preference for a running number of candles' data. If you are interested to know short term changes in volume (e.g. over the past few candles at a major level) you can adjust this setting lower (~3-9 length). Conversely, if you are interested in volume trends over a greater number of candles you can increase this to your liking.
Personal preference : Because I am a short term daytrader/ scalper, I keep this setting at 6 length to see immediate changes in the acceleration or deceleration of buyers/ sellers.
2. The Smoothing Factor: The smoothing factor can be adjusted to further tune the size of trend you are interested in with 1 = No smoothing of the EMA line. Smoothing of the EMA line increases as the value for smoothing increases, resulting in a less volatile, more smooth EMA line. However, the more smooth the line, the less sensitive the EMA will be to immediate changes in volume pace. The less smoothing factor is applied, the more volatile data will be, resulting in quicker observation of shorter term trends. Again the same rules apply as the EMA length as these are similar in function: If you are interested to know short term changes in volume (e.g. over the past few candles at a major level) you can adjust this setting lower (~2-6). Conversely, if you are interested in volume trends over a greater number of candles you can increase this to your liking.
Personal preference : Because I am a short term daytrader/ scalper, I keep this setting at 2-4 smoothing factor to see immediate changes in the acceleration or deceleration of buyers/ sellers.
You should, of course, play with these settings to your exact preferences based on your trading style.
Tips for using this indicator:
General Use:
When the buy volume EMA is moving up, buyers are increasing the pace of buying and when the buy volume EMA is moving down, buyers are decreasing the pace of buying. Conversely, when the sell volume EMA is moving up, sellers are increasing the pace of selling and when the sell volume EMA is moving down, sellers are decreasing the pace of selling. The overall movement of the stock is relative to the combination of these rates. e.g. If both buyers and sellers are increasing at the same rate (EMAs slopes are roughly equal) there will be not a large change in price. If the slope of the buy volume EMA is greater than the slope of sell volume EMA, the price should move up. Conversely, if the slope of the sell volume EMA is greater than the slope of buy volume EMA, the price should move down.
Predicting pullbacks, reversals, and continuations:
This indicator allows you to see if buyers or sellers are increasing their pace, even if the stock price is in consolidation. This allows you to predict if out of the consolidation buyers or sellers are likely to win based on the momentum of the volume in consolidation. e.g. If price is in consolidation after an uptrend and the buy volume EMA starts to decrease, this could be a sign that buyers are running out of steam at this price level. Another example, If at a major support the buy volume EMA begins to trend up then buyers are accelerating the pace of buying at this level.
EMA crosses: There is something to be said about the point at which the buy volume EMA and sell volume EMA cross. This signifies that at this moment there is a shift in which the acceleration of one party outpaces that of the other and can result in increased speed of the movement of the stock price.
Considerations
Because volume changes constantly, this indicator is best to identify short term changes in volume that could impact price movements. It is not guaranteed to continue just because buyers or sellers have had a change in pace. Therefore it is advised to use this indicator in combination with significant price levels such as pivot points, or price levels from volume profile tools to identify the price zones where significant volume changes are likely to impact price movements. It is also advised to continue to monitor the changes in pace in buyers and sellers using this volume EMA indicator to determine if a change in pace is short lived or if it will continue for a longer duration.
Examples of use:
Bullish Reversal:
Bearish Continuation:
Bearish EMA Crossover: (Settings: Length 6, Smoothing factor 3)
Bullish EMA Crossover: (Settings: Length 6, Smoothing factor 4)
RVol+ Enhanced Relative Volume Indicator📊 RVol+ Enhanced Relative Volume Indicator
Overview
RVol+ (Relative Volume Plus) is an advanced time-based relative volume indicator designed specifically for swing traders and breakout detection. Unlike simple volume comparisons, RVol+ analyzes volume at the same time of day across multiple sessions, providing statistically significant insights into institutional activity and breakout potential.
🎯 Key Features
Core Volume Analysis
Time-Based RVol Calculation - Compares current cumulative volume to the average volume at this exact time over the past N days
Statistical Z-Score - Measures volume in standard deviations from the mean for true anomaly detection
Volume Percentile - Shows where current volume ranks historically (0-100%)
Sustained Volume Filter - 3-bar moving average prevents false signals from single-bar spikes
Breakout Detection
🚀 Confirmed Breakouts - Identifies price breakouts validated by high volume (RVol > 1.5x)
⚠️ False Breakout Warnings - Alerts when price breaks key levels on low volume (high failure risk)
Multi-Timeframe Context - Weekly volume overlay prevents chasing daily noise
Advanced Metrics
OBV Divergence Detection - Spots bullish/bearish accumulation/distribution patterns
Volume Profile Integration - Identifies institutional positioning
Money Flow Analysis - Tracks smart money vs retail activity
Extreme Volume Alerts - 🔥 Labels mark unusual spikes beyond the display cap
Visual Intelligence
Smart Color Coding:
🟢 Bright Teal = High activity (RVol ≥ 1.5x)
🟡 Medium Teal = Caution zone (RVol ≥ 1.2x)
⚪ Light Teal = Normal activity
🟠 Orange = Breakout confirmed
🔴 Red = False breakout risk
Comprehensive Stats Table:
Current Volume (formatted as M/K/B)
RVol ratio
Z-Score with significance
Volume percentile
Historical average and standard deviation
Sustained volume confirmation
📈 How to Use
For Swing Trading (1D - 3W Holds)
Perfect Setup:
✓ RVol > 1.5x (bright teal)
✓ Z-Score > 2.0 (⚡ alert)
✓ Percentile > 90%
✓ Sustained = ✓
✓ 🚀 Breakout label appears
Avoid:
✗ Red "Low Vol" warning during breakouts
✗ RVol < 1.0 at key levels
✗ Sustained volume not confirmed
Signal Interpretation
⚡ Z>2 Labels - Statistically significant volume (95th+ percentile) - highest probability moves
↗️ OBV+ Labels - Bullish accumulation (OBV rising while price consolidates)
↘️ OBV- Labels - Bearish distribution (OBV falling while price rises)
🔵 Blue Background - Weekly volume elevated (confirms daily strength)
⚙️ Customization
Basic Settings
N Day Average - Number of historical days for comparison (default: 5)
RVol Thresholds - Customize highlight levels (default: 1.2x, 1.5x)
Visual Display Cap - Prevent extreme spikes from compressing view (default: 4.0x)
Advanced Metrics (Toggle On/Off)
Z-Score analysis
Weekly RVol context
OBV divergence detection
Volume percentile ranking
Breakout signal generation
Table Customization
Position - 9 placement options to avoid chart overlap
Size - Tiny to Huge
Colors - Full customization of positive/negative/neutral values
Transparency - Adjustable background
Debug Mode
Enable Pine Logs for calculation transparency
Adjustable log frequency
Real-time calculation breakdown
🔬 Technical Details
Algorithm:
Binary search for historical lookups (O(log n) performance)
Time-zone aware session detection
DST-safe timestamp calculations
Exponentially weighted standard deviation
Anti-repainting architecture
Performance:
Optimized for max_bars_back = 5000
Efficient array management
Built-in function optimization
Memory-conscious data structures
📊 What Makes RVol+ Different?
vs. Standard Volume:
Context-aware (time-of-day matters)
Statistical significance testing
False breakout filtering
vs. Basic RVol:
Z-Score normalization (2-3 sigma detection)
Multi-timeframe confirmation
OBV divergence integration
Sustained volume filtering
Smart visual scaling
vs. Professional Tools:
Free and open-source
Fully customizable
No black-box algorithms
Educational debug logs
💡 Best Practices
Wait for Confirmation - Don't enter on first bar; wait for sustained volume ✓
Combine with Price Action - RVol validates, price structure determines entry
Weekly Context Matters - Blue background = institutional interest
Z-Score is King - Focus on ⚡ alerts for highest probability
Avoid Low Volume Breakouts - Red ⚠️ labels = high failure risk
🎓 Trading Psychology
Volume precedes price. When RVol+ shows:
High RVol + Rising OBV = Accumulation before breakout
High RVol at Resistance = Test of conviction
Low RVol on Breakout = Retail-driven (fade candidate)
Z-Score > 3 = Potential "whale" positioning
📝 Credits
Based on the time-based RVol concept from /u/HurlTeaInTheSea, enhanced with:
Statistical analysis (z-scores, percentiles)
Multi-timeframe integration
OBV divergence detection
Professional-grade visualization
Swing trading optimization
🔧 Version History
v2.0 - Enhanced Edition
Added Z-Score analysis
Multi-timeframe volume context
OBV divergence detection
Breakout confirmation system
Smart color coding
Customizable stats table
Debug logging mode
Performance optimizations
📚 Learn More
For optimal use with swing trading:
Combine with support/resistance levels
Watch for volume clusters in consolidation
Use weekly timeframe for trend confirmation
Monitor OBV divergence for early warnings
⚠️ Disclaimer
This indicator is for educational purposes. Volume analysis is one component of trading decisions. Always use proper risk management, consider multiple timeframes, and validate signals with price structure. Past performance does not guarantee future results.
🚀 Getting Started
Add indicator to chart
Adjust "N Day Average" to your preference (5-10 days typical)
Position stats table to avoid overlap
Enable features you want to monitor
Watch for 🚀 breakout confirmations!
Happy Trading! 📈

Smart Money Flow TrackerSmart Money Flow Tracker - Liquidity & Fair Value Gap Indicator
Overview
The Smart Money Flow Tracker is a comprehensive Pine Script indicator designed to identify and analyze institutional trading patterns through liquidity prints and Fair Value Gaps (FVGs). This advanced tool combines multiple analytical approaches to help traders understand where smart money is operating in the market, providing crucial insights for better trade timing and market structure analysis.
Core Functionality
1. Liquidity Prints Detection
The indicator identifies liquidity prints by analyzing pivot highs and lows that represent potential areas where institutional orders may be resting. Key features include:
Pivot-Based Analysis: Uses configurable pivot lengths (default 5) to identify significant highs and lows
Volume Confirmation: Optional volume filter ensures liquidity prints occur during periods of significant trading activity
Dynamic Labeling: Visual markers on chart showing liquidity print locations with customizable colors
Success Rate Tracking: Monitors how often liquidity prints lead to meaningful price reactions
2. Fair Value Gap (FVG) Analysis with Volume Integration
Advanced FVG detection that goes beyond basic gap identification:
Three-Bar Pattern Recognition: Identifies gaps where the high of bar 1 is below the low of bar 3 (bullish) or low of bar 1 is above high of bar 3 (bearish)
Volume-Enhanced Detection: Incorporates comprehensive volume analysis including:
Average volume calculation over configurable periods
Total volume across the 3-bar FVG pattern
Dominant volume bar identification
Volume ratio calculations for strength assessment
Volume Threshold Filtering: Optional minimum volume requirements to filter out low-conviction FVGs
Visual Enhancement: FVG boxes with volume-based coloring and detailed volume labels
3. Comprehensive Statistics Dashboard
Real-time statistics table displaying:
Total liquidity prints detected
Success rate percentage with dynamic color coding
Volume filter status
Total Fair Value Gaps identified
High-volume FVG count and percentage
All metrics update in real-time as new data becomes available
4. Advanced Alert System
Multiple alert conditions for different scenarios:
Standard liquidity print detection
Volume-confirmed liquidity prints
Bullish and bearish FVG formation
High-volume FVG alerts for institutional-grade setups
Key Input Parameters
Display Controls
Show Liquidity Prints: Toggle main functionality on/off
Show Statistics Table: Control visibility of the analytics dashboard
Show Fair Value Gaps: Enable/disable FVG detection and display
Technical Settings
Pivot Length: Adjusts sensitivity of liquidity print detection (1-20 range)
Volume Confirmation: Requires above-average volume for liquidity print validation
Volume Lookback: Period for calculating average volume (5-50 bars)
FVG Volume Settings
Show FVG Volume Info: Display detailed volume metrics on FVG labels
FVG Volume Threshold: Minimum volume multiplier for high-volume FVG classification
FVG Volume Average Period: Lookback period for FVG volume calculations
Visual Customization
Bullish/Bearish Colors: Separate color schemes for different market directions
Text Colors: Bright lime green for optimal visibility on all background types
Table Positioning: Flexible placement options for the statistics dashboard
Trading Applications & Use Cases
1. Institutional Order Flow Analysis
Liquidity Hunting: Identify areas where institutions may be targeting retail stops
Smart Money Tracking: Follow institutional footprints through volume-confirmed liquidity prints
Market Structure Understanding: Recognize key levels where large orders are likely resting
2. Fair Value Gap Trading Strategies
Gap Fill Trading: Trade the statistical tendency of FVGs to get filled
Volume-Confirmed Entries: Use high-volume FVGs as higher-probability trade setups
Institutional FVG Recognition: Focus on FVGs with dominant volume bars indicating institutional participation
3. Multi-Timeframe Analysis
Higher Timeframe Context: Use on daily/weekly charts to identify major institutional levels
Intraday Precision: Apply to lower timeframes for precise entry and exit timing
Cross-Timeframe Confirmation: Combine signals across multiple timeframes for enhanced accuracy
4. Risk Management Applications
Stop Loss Placement: Use liquidity print levels as logical stop loss areas
Position Sizing: Adjust position sizes based on volume confirmation and success rates
Trade Filtering: Use statistics dashboard to assess current market conditions
Technical Logic & Methodology
Liquidity Print Algorithm
Pivot Identification: Scans for pivot highs/lows using the specified lookback period
Volume Validation: Optionally confirms prints occur during above-average volume periods
Success Tracking: Monitors subsequent price action to calculate effectiveness rates
Dynamic Updates: Continuously updates statistics as new data becomes available
FVG Detection Process
Pattern Recognition: Identifies 3-bar patterns with qualifying gaps
Volume Analysis: Calculates comprehensive volume metrics across the pattern
Strength Assessment: Determines volume ratios and dominant bars
Classification: Categorizes FVGs based on volume thresholds and characteristics
Visual Representation: Creates boxes and labels with volume-based styling
Statistical Framework
Real-time Calculations: All metrics update with each new bar
Percentage-based Metrics: Success rates and volume confirmations shown as percentages
Color-coded Feedback: Visual indicators for quick assessment of current conditions
Historical Tracking: Maintains running totals throughout the session
Best Practices for Usage
1. Parameter Optimization
Start with default settings and adjust based on market conditions
Lower pivot lengths for more sensitive detection on volatile instruments
Higher volume thresholds for cleaner signals in high-volume markets
2. Market Context Consideration
Combine with broader market structure analysis
Consider economic events and news that may affect institutional flow
Adjust expectations based on market volatility and liquidity conditions
3. Integration with Other Analysis
Use alongside support/resistance levels for confluence
Combine with momentum indicators for timing confirmation
Integrate with volume profile analysis for additional context
Conclusion
The Smart Money Flow Tracker represents a sophisticated approach to institutional flow analysis, combining traditional liquidity concepts with modern volume analytics. By providing both visual signals and comprehensive statistics, it enables traders to make more informed decisions based on where smart money is likely operating in the market. The indicator's flexibility and customization options make it suitable for various trading styles and timeframes, from scalping to position trading.

ICT Institutional Order Flow (Riz)This indicator implements Inner Circle Trader (ICT) institutional order flow concepts to identify high-probability entry points where smart money is actively participating in the market. It combines volume analysis, market structure, and price action patterns to detect institutional accumulation and distribution zones.
Core Concepts & Methodology
1. Institutional Order Blocks Detection
Order blocks represent the last opposing candle before a strong directional move, indicating institutional accumulation (bullish) or distribution (bearish) zones.
How it works:
⦁ Identifies the final bearish candle before bullish expansion (accumulation)
⦁ Identifies the final bullish candle before bearish expansion (distribution)
⦁ Validates with volume spike (2x average) to confirm institutional participation
⦁ Requires minimum 0.5% price displacement to filter weak moves
⦁ Tracks these zones as future support/resistance levels
2. Fair Value Gap (FVG) Analysis
FVGs are price inefficiencies created by aggressive institutional orders that leave gaps in price action.
Detection method:
⦁ Bullish FVG: When current low > high from 2 bars ago
⦁ Bearish FVG: When current high < low from 2 bars ago
⦁ Minimum gap size filter (0.1% default) eliminates noise
⦁ Monitors gap fills with volume for entry signals
⦁ Gaps act as magnets drawing price back for "rebalancing"
3. Liquidity Hunt Detection
Institutions often trigger retail stop losses before reversing direction, creating liquidity for their positions.
Algorithm:
⦁ Calculates rolling 20-period highs/lows as liquidity pools
⦁ Detects wicks beyond these levels (0.1% sensitivity)
⦁ Identifies rejection back inside range (liquidity grab)
⦁ Volume spike confirmation ensures institutional involvement
⦁ These reversals often mark significant turning points
4. Volume Profile Integration
Analyzes volume distribution across price levels to identify institutional interest zones.
Components:
⦁ Point of Control (POC): Price level with highest volume (institutional consensus)
⦁ Value Area: 70% of volume range (institutional comfort zone)
⦁ Uses 50-bar lookback to build volume histogram
⦁ 20 price levels for granular distribution analysis
5. Market Structure Analysis
Determines overall trend bias using pivot points and swing analysis.
Process:
⦁ Identifies swing highs/lows using 3-bar pivots
⦁ Bullish structure: Price above last swing high
⦁ Bearish structure: Price below last swing high
⦁ Filters signals to trade with institutional direction
Signal Generation Logic
BUY signals trigger when ANY condition is met:
1. Order Block Formation: Bearish-to-bullish transition + volume spike + strong move
2. Liquidity Grab Reversal: Sweep below lows + recovery + volume spike
3. FVG Fill: Price fills bullish gap with institutional volume (within 3 bars)
4. Order Block Respect: Price bounces from previous bullish OB + volume
SELL signals trigger when ANY condition is met:
1. Order Block Formation: Bullish-to-bearish transition + volume spike + strong move
2. Liquidity Grab Reversal: Sweep above highs + rejection + volume spike
3. FVG Fill: Price fills bearish gap with institutional volume (within 3 bars)
4. Order Block Respect: Price rejects from previous bearish OB + volume
Additional filters:
⦁ Signals align with market structure (no counter-trend trades)
⦁ No new signals while position is active
⦁ All signals require volume confirmation (institutional fingerprint)
Trading Style Auto-Configuration
The indicator features intelligent preset configurations for different trading styles:
Scalping Mode (1-5 min charts):
⦁ Volume multiplier: 1.5x (more signals)
⦁ Tighter parameters for quick trades
⦁ Risk:Reward 1.5:1, ATR multiplier 1.0
Day Trading Mode (15-30 min charts):
⦁ Volume multiplier: 1.7x (balanced)
⦁ Medium sensitivity settings
⦁ Risk:Reward 2:1, ATR multiplier 1.5
Swing Trading Mode (1H-4H charts):
⦁ Volume multiplier: 2.0x (quality focus)
⦁ Conservative parameters
⦁ Risk:Reward 3:1, ATR multiplier 2.0
Custom Mode:
⦁ Full manual control of all parameters
Visual Components
⦁ Order Blocks: Colored rectangles (green=bullish, red=bearish)
⦁ Fair Value Gaps: Orange boxes showing imbalances
⦁ Liquidity Levels: Dashed blue lines at key highs/lows
⦁ Volume Spikes: Yellow background highlighting
⦁ POC Line: Orange line showing highest volume price
⦁ Value Area: Blue shaded zone of 70% volume
⦁ Buy/Sell Signals: Triangle markers with text labels
⦁ Stop Loss/Take Profit: Dotted lines (red/green)
Information Panel
Real-time dashboard displaying:
⦁ Current trading mode
⦁ Volume ratio (current vs average)
⦁ Market structure (bullish/bearish)
⦁ Active order blocks count
⦁ Position status
⦁ Configuration details
How to Use
Step 1: Select Trading Style
Choose your style in settings - all parameters auto-adjust
Step 2: Timeframe Selection
⦁ Scalping: 1-5 minute charts
⦁ Day Trading: 15-30 minute charts
⦁ Swing: 1H-4H charts
Step 3: Signal Interpretation
⦁ Wait for BUY/SELL markers
⦁ Check volume ratio >2 for strong signals
⦁ Verify market structure alignment
⦁ Note automatic SL/TP levels
Step 4: Risk Management
⦁ Default 2:1 risk:reward (adjustable)
⦁ Stop loss: 1.5x ATR from entry
⦁ Position sizing based on stop distance
Best Practices
1. Higher probability setups occur when multiple conditions align
2. Volume confirmation is crucial - avoid signals without volume spikes
3. Trade with structure - longs in bullish, shorts in bearish structure
4. Monitor POC - acts as dynamic support/resistance
5. Confluence zones where OBs, FVGs, and liquidity levels overlap are strongest
Important Notes
⦁ Not a standalone system - combine with your analysis
⦁ Works best in trending markets with clear structure
⦁ Adjust settings based on instrument volatility
⦁ Backtest thoroughly on your specific markets
⦁ Past performance doesn't guarantee future results
Alerts Available
⦁ ICT Buy Signal
⦁ ICT Sell Signal
⦁ Volume Spike Detection
⦁ Liquidity Grab Detection
This indicator provides a systematic approach to ICT concepts, helping traders identify where institutions are entering positions through volume analysis and key price action patterns. The auto-configuration feature ensures optimal settings for your trading style without manual adjustment.
Disclaimer
This tool is for educational and research purposes only. It is not financial advice, nor does it guarantee profitability. All trading involves risk, and users should test thoroughly before applying live.

Trading Sessions (L3J) Trading Sessions Indicator (L3J)
Overview
This Pine Script indicator displays precise trading session boxes for the three major global trading sessions: Asia, London, and US (Cash). Unlike traditional session indicators that show continuous background colors, this script creates rectangular boxes that precisely delimit each session from start to finish.
Features
🌍 Global Timezone Support
- 39 timezone options covering all major financial centers
- Automatic daylight saving time adjustments for named timezones
- Universal compatibility with all TradingView charts
📦 Session Boxes
- Precise delimitation: Each session is contained within a rectangular box
- Dynamic sizing: Boxes automatically adjust to session high/low prices
- Visual distinction: Completed sessions (solid borders) vs ongoing sessions (dashed borders)
- Customizable borders: Toggle on/off with adjustable thickness (0-5px)
🎨 Visual Customization
- Individual session colors: Fully customizable for Asia, London, and US sessions
- Border matching: Border colors automatically match session box colors
- Transparency control: Built-in opacity settings for each session
- Clean interface: Minimal visual clutter with maximum information
⚙️ Management Options
- Box limit control: Set maximum number of historical boxes per session (1-50)
- Automatic cleanup: Old boxes are automatically removed to maintain performance
- Memory efficient: Optimized for long-term chart analysis
Default Session Times (EDT - Etc/GMT+4)
| Session | Default Hours | Markets Covered |
|---------|---------------|-----------------|
| Asia | 18:00 - 02:00 | Tokyo, Sydney, Hong Kong |
| London | 02:00 - 11:00 | London, Frankfurt, European markets |
| US Cash | 09:30 - 16:00 | NYSE, NASDAQ |
> Note: Default times are in EDT (Eastern Daylight Time). Adjust session hours according to your selected timezone.
Timezone Conversion Examples
For UTC Users:
- Asia: 22:00 - 06:00
- London: 06:00 - 15:00
- US: 13:30 - 20:00
For Europe/London Users:
- Asia: 23:00 - 07:00
- London: 07:00 - 16:00
- US: 14:30 - 21:00
Usage Instructions
1. Add to chart: Apply the indicator to any timeframe
2. Select timezone: Choose your local timezone from the dropdown
3. Adjust session hours: Modify session times if needed for your timezone
4. Customize appearance: Set colors, borders, and box limits
5. Enable/disable sessions: Toggle individual sessions on/off as needed
Technical Specifications
- Pine Script Version: v6
- Chart Type: Overlay indicator
- Maximum Objects: 150 boxes, 500 lines, 200 labels
- Performance: Optimized for real-time updates
- Compatibility: All TradingView chart types and timeframes
Integration with Other Scripts
This indicator is designed to work seamlessly with other L3J trading scripts:
- ICT Levels Indicators: Provides session context for key levels
- Market Structure Scripts: Session boxes help identify structural breaks
- Volume Profile Tools: Session delimitation for volume analysis
- Support/Resistance Scripts: Session-based level identification
> Recommended: Use this as a base layer with other L3J indicators for comprehensive market analysis.
Key Benefits
🎯 Precision Trading
- Exact session boundaries: No guesswork about session start/end times
- Clean visual reference: Clear session delimitation for strategy execution
- Multi-timeframe compatibility: Works on all chart timeframes
📊 Professional Analysis
- Institution-grade accuracy: Matches professional trading platforms
- Customizable for any strategy: Adaptable to various trading approaches
- Performance optimized: Minimal impact on chart loading times
🔄 Real-time Updates
- Live session tracking: Ongoing sessions update in real-time
- Automatic management: Old sessions are cleaned up automatically
- Memory efficient: Optimized for extended trading sessions
Author Information
Created by: L3J
Version: 1.0
Category: Session Analysis / Market Hours
License: For use with L3J trading script ecosystem
---
Support & Integration
This indicator is part of the L3J Trading Script Collection. For optimal results, combine with other L3J indicators:
- ICT Key Levels
- Market Structure Analysis
- Volume Profile Tools
- Support/Resistance Scripts
Note: This script is specifically designed to complement and enhance other L3J trading tools. Individual use is supported, but maximum effectiveness is achieved when used as part of the complete L3J trading system.
---
For technical support or integration questions, refer to the L3J script documentation or community resources.

Manual VAH/VAL LevelsManual VAH/VAL Levels is a utility indicator that lets traders manually display the Value Area High (VAH) and Value Area Low (VAL) from the prior trading day, based on a Fixed Range Volume Profile tool.
This script is designed to:
Draw horizontal lines at the manually input VAH and VAL levels
Label each line with the corresponding price, aligned clearly to the right of the chart
Display levels only during the regular trading session for focused market context
Maintain a clean chart appearance with transparent label backgrounds
💡 How to Use:
Apply TradingView's Fixed Range Volume Profile tool to the prior day's session
Manually enter the VAH and VAL values into the script settings
The script will draw and label these levels dynamically during the NY market session
This tool is ideal for:
Traders using volume-based key levels for intraday decision-making
Contextualizing price action near areas of prior day value
Confluence analysis when paired with opening range, CVD, or breakout systems

Smart Money Concepts + Fibonacci + EMA - AI Enhanced Analysis### █ OVERVIEW
This indicator is not just another "all-in-one" tool; it's a **specialized data visualization layer designed for the new era of AI-driven chart analysis**. The primary purpose of the **"NarmoonAI"** indicator is to structure and display key market information in a clean, consistent, and machine-readable format.
Standard charts can be noisy and ambiguous for AI Vision models (like Google's Gemini or OpenAI's GPT-4). This script solves that problem by consolidating the most crucial technical analysis concepts—Smart Money Concepts, Trend Analysis, and Key Levels—into a clear visual language that an AI can easily interpret from a single screenshot.
This approach allows traders to leverage the power of artificial intelligence for faster, more objective, and deeper market analysis. It's designed to work seamlessly with our custom AI assistant, the **NarmoonAI Telegram Bot**, but can be used with any modern AI vision tool.
---
### █ CORE COMPONENTS & LOGIC
This indicator is a "mashup" with a clear purpose: to create a comprehensive yet clean analytical framework. Here is how each component contributes to the overall goal of AI-enhanced analysis:
**1. Smart Money Concepts (Supply & Demand Zones):**
* **How it works:** The script automatically identifies significant market turning points by detecting swing highs and lows using `ta.pivothigh` and `ta.pivotlow` over a user-defined `Swing Length`. These pivots form the basis of our Supply (resistance) and Demand (support) zones.
* **The "Smart" Edge:** To filter out weaker zones, the indicator analyzes the volume profile. Zones that are formed during periods of high volume (defined as >1.5x the 20-period simple moving average of volume) are highlighted in a stronger, more vibrant color. This signals areas of high institutional interest, a key concept in Smart Money analysis.
**2. Multi-Layered Trend Analysis (Exponential Moving Averages - EMAs):**
* **How it works:** We've included a customizable suite of four essential EMAs (20, 50, 100, and 200). These are not just random lines; they provide an instant visual reference for short, medium, and long-term trend direction and dynamic support/resistance.
* **Why it's useful for AI:** An AI can instantly parse the order and slope of these EMAs. For example, it can identify a strong uptrend when the price is above the 20 EMA, which is above the 50 EMA, and so on.
**3. Automatic Fibonacci Retracement:**
* **How it works:** Manually drawing Fibonacci levels is subjective and time-consuming. This script automates the process by identifying the highest high and lowest low over a `Fibonacci Lookback Period` (defaulting to 100 bars) and automatically plots the key retracement levels (0.236, 0.382, 0.5, 0.618, 0.786).
* **Why it's useful for AI:** It provides objective, universally recognized potential support and resistance levels without any manual drawing, ensuring a clean and consistent chart for analysis.
**4. Dynamic Trend Channels:**
* **How it works:** The indicator automatically draws trend channels by connecting the two most recent significant pivot highs (for a downtrend channel) or pivot lows (for an uptrend channel).
* **The "Dynamic" Edge:** The width of the channel is not fixed. It's dynamically calculated using the Average True Range (ATR), allowing the channel to expand and contract based on the market's current volatility. This provides a much more adaptive and realistic view of the trend's boundaries.
---
### █ HOW TO USE THIS INDICATOR
There are two primary ways to use the NarmoonAI indicator:
**A) For AI-Powered Analysis (Recommended):**
1. Apply the **NarmoonAI** indicator to any chart.
2. Take a clean screenshot of your chart.
3. Upload the image to your preferred AI Vision model (e.g., Gemini, ChatGPT) or, for the best results, use our specialized **NarmoonAI Telegram bot**.
4. Ask the AI for a detailed analysis. **Example Prompts:**
* *"Based on this chart, what is the current market structure? Identify key support and resistance levels."*
* *"Is there a potential long setup forming according to the information from the NarmoonAI indicator?"*
* *"Summarize the trend direction and strength using the EMAs and trend channels shown."*
**B) For Manual Trading:**
Traders can use the confluence of signals for high-probability setups:
* **High-Probability Long:** Look for the price to enter a **Strong Demand Zone** that aligns with a key **Fibonacci level** (e.g., 0.618) and is respected by a major **EMA** (e.g., the 50 or 100 EMA).
* **High-Probability Short:** Look for the price to test a **Strong Supply Zone** near the top of a **descending trend channel**, with EMAs confirming the bearish momentum.
---
*This script was created by NarmoonAI to bridge the gap between traditional technical analysis and the powerful capabilities of modern artificial intelligence. We believe this is the future of trading analysis.*